2016 Top Markets Report
Industrial Automation
A Market Assessment Tool for U.S. Exporters
U.S. Department of Commerce | International Trade Administration | Industry & Analysis (I&A)
April 2016
Industry & Analysis’ (I&A) staff of industry, trade and economic analysts
devise and implement international trade, investment, and export
promotion strategies that strengthen the global competitiveness of U.S.
industries. These initiatives unlock export, and investment opportunities
for U.S. businesses by combining in-depth quantitative and qualitative
analysis with ITA’s industry relationships.
For more information, visit
www.trade.gov/industry
I&A is part of the International Trade Administration, whose mission is to
create prosperity by strengthening the competitiveness of U.S. industry,
promoting trade and investment, and ensuring fair trade and compliance
with trade laws and agreements.
Andrew Moyseowicz served as the lead author of this report. A note of
thanks goes to Padraic Sweeney, Forrest Nielsen, Kit Rudd and Scott
Kennedy of the Office of Transportation and Machinery for their support. A
special note of acknowledgement goes to Mario Vidana, Stefan Popescu,
Volker Wirsdorf, Klaus Jonas, Yiu Kei Chan, and Luciana Escobar of the
U.S. Foreign Commercial Service for their insightful observations.
2016 ITA Industrial Automation Top Markets Report 1
Table of Contents
Executive Summary ............................................................................................................................... 3
Overview & Key Findings .................................................................................................................... 5
Country Case Studies Mexico ...................................................................................................................................................... 15 Canada ...................................................................................................................................................... 19 Germany .................................................................................................................................................. 23 Singapore ................................................................................................................................................ 27 Brazil ......................................................................................................................................................... 31
Addendum: Resources for U.S. Exporters ................................................................................... 35
Appendices Appendix 1: Methodology ................................................................................................................ 37 Appendix 2: Notes and Citations .................................................................................................... 39
2016 ITA Industrial Automation Top Markets Report 2
This Page Intentionally Left Blank
2016 ITA Industrial Automation Top Markets Report 3
Executive Summary
The United States is a major global producer of industrial automation equipment, broadly defined as the hardware
and components used to automate systems in manufacturing or industrial settings. With nearly $10.5 billion worth
of exported equipment in 2015, the United States remains a competitive top-tier supplier to global markets.
Despite a slight decrease overall from 2014 to 2015, the next two years will likely see increases in U.S. industrial
automation exports. This is largely a result of the growing global market for automation equipment, for which the
United States is a top-tier supplier. The industrial automation market is driven by the need to reduce operational
costs and improve productivity. While the recession of 2008 has largely passed, the deep impression left by the
global credit crunch will continue to drive companies to streamline processes and automate production. This in
turn will drive demand for industrial automation products in the short term.
In the medium to long-term, demand for automation equipment will only continue to grow as companies derive
more and more value from cost-cutting and labor-reduction. As sensor technologies improve and the ability to
harness and analyze big data becomes more viable in real time, the limits of operational efficiency in
manufacturing, processing, material handling and logistics industries will continue to be pushed.
U.S. exports will continue to increase largely because of sales to NAFTA partner Mexico. Sales to Canada will
continue to be high in volume, but they will likely face headwinds on the account of several factors. In the
European market, Germany and the United Kingdom will remain key partners, with growth opportunities coming
from the Netherlands and the smaller economies of Ireland and Poland. China will remain a major destination for
U.S. equipment in Asia, though to a lesser extent owing to the onset of an economic slowdown. Growth
opportunities will be present in Japan and Singapore and the smaller economies of Thailand and Malaysia. In South
America, Brazil is the largest market for automation equipment, but recent economic and political challenges may
hamper growth in the short term.
This ITA Top Markets report attempts to provide guidance to companies and U.S. government trade agencies by
assessing and ranking foreign markets based on export potential. Based on trade data and global industrial indices,
along with market intelligence from U.S. Foreign Commercial Service Officers, our rankings represent the best
current understanding of market opportunities. The report also provides exporters with detailed assessments of
selected markets by providing five country case-studies: Brazil, Canada, Mexico, Germany and Singapore.
Figure 1: Projected Top Markets for 2016-2017
1 Mexico 8 South Korea 15 Thailand 22 Peru 29 Venezuela
2 Canada 9 Netherlands 16 Ireland 23 Australia 30 Chile
3 Germany 10 Vietnam 17 Colombia 24 France 31 UAE
4 China 11 United Kingdom 18 Norway 25 Switzerland 32 Israel
5 Poland 12 Brazil 19 India 26 Belgium 33 South Africa
6 Japan 13 Saudi Arabia 20 Italy 27 Argentina 34 Malaysia
7 Singapore 14 Taiwan 21 Russia 28 Spain 35 Hong Kong
2016 ITA Industrial Automation Top Markets Report 4
This Page Intentionally Left Blank
2016 ITA Industrial Automation Top Markets Report 5
Overview & Key Findings
Introduction
The United States is a major global producer of
industrial automation equipment. In 2015, U.S.
companies exported nearly $10.5 billion worth of
products to foreign markets. This was down from
nearly $10.7 billion in 2014, representing the first
decrease in annual exports since the 2008 recession.
Most of these sales went to highly developed
markets with deeply embedded industrial bases and
robust public infrastructure. As will be illustrated,
however, demand for automation equipment is also
growing in developing markets, which are more
geared toward commodity production and lesser-
valued outputs.
2015 has seen a number of high level developments
that have broadly affected global markets. In the
currency markets, the rising strength of the
American Dollar created headwinds for many U.S.
manufacturers by reducing prices of imported
products into the domestic market. At the same
time, the strong dollar raised prices of U.S. exports,
particularly in the Eurozone and emerging markets
like Brazil. In China, the 2nd largest global economy
suffered significant slides in the stock market,
attributed to signs of slowing growth. The
exceedingly low cost of oil also affected many
exporting countries across the world. By the end of
2015, however, for the first time since the 2008
recession, the Federal Reserve raised key interest
rates as a general show of confidence in the
strengthening U.S. economy. The December 2015
unemployment rate declined to 5.0 percent, the
lowest in nearly a decade. Going into 2016, the U.S.
economy appears poised for growth, even as much
of the world struggles.
As global markets face uncertainty, developing an
export strategy has become more important than
ever for U.S. companies. Businesses looking to
increase sales and profit, reduce dependence on the
domestic market, and stabilize seasonal fluctuations
should consider selling abroad. Nearly 96 percent of
consumers live outside the United States, and two-
thirds of the world’s purchasing power is located in
foreign countries.
Key Findings: Top Markets and Methodology
This ITA Top Markets report attempts to assess the
global market for automation equipment by
analyzing U.S. exports in this sector: what products
they are, where they are going, and the dollar value
attached to each sale. To establish a priority of
foreign markets that offer the best prospects for U.S.
producers of industrial automation equipment, four
criteria were used:
• total volume of U.S. industrial automation
exports in 2015, as measured by U.S. Census
Bureau Foreign Trade Division;
• compound annual growth rate (CAGR) of U.S.
industrial automation exports between 2009
and 2015, as measured by U.S. Census Bureau
Foreign Trade Division;
• most up-to-date ranking (2012) of market by
United Nations Industrial Development
Organization (UNIDO) “Competitive Industrial
Performance Index”; and
• level of growth in industrialization as measured
by rate of improvement in 2009 through 2012
UNIDO “Competitive Industrial Performance
Index” rankings.
U.S. exports are defined as products originating in
the United States, which is an important distinction
to make in an increasingly globalized economy.
Products that do not meet the minimum threshold
of content made in the United States are not taken
into account.
In ranking markets, ITA placed the most emphasis on
the total volume of exports in 2015. It is presumed
that markets with historically high U.S. exports will
continue to have high volumes in the future for a
variety of reasons. Historic export trends indirectly
take into account factors specific to the United
States, such as geography, Free Trade Agreements
(FTA) and size of market opportunity.
2016 ITA Industrial Automation Top Markets Report 6
Some may contend that size of the market is the
most important factor in global rankings. In other
words, the largest markets will present the greatest
market opportunities. While valid to an extent, this
logic does not take into account the variety of
economic, historic and political factors that shape
global trade. For example, top-ranked Mexico is not
objectively the “largest” global market for industrial
automation equipment, a position held definitively
by China. Mexico, nonetheless, continues to present
unparalleled opportunities for U.S. exporters
because of its shared border and lack of tariffs.
China, on the other hand, may be the largest
importer of industrial automation products in the
world, but U.S. exporters must contend more with
regional competitors, such as Japan, Korea and
Taiwan, which will affect pricing and market entry.
Size also does not take into account market access
barriers, such as tariffs, or policy prescriptions, such
as export controls, which may apply to U.S.
exporters. As a result, while the information
provided in this report may be of general use to
companies across all of industry, its utility is truly
intended for U.S. exporters of industrial automation
products.
Based on aggregated trade data and global industrial
indices, this report ranks global markets based on
their export potential. These rankings represent the
best current understanding of market opportunities.
Paired with on-the-ground market intelligence from
U.S. Foreign Commercial Service officers, this report
aims to assist exporters in better determining global
sales opportunities in their industry.
This Top Markets Report will focus on the export
forecast for products falling broadly into five
categories:
• Sensors and Instruments for monitoring and
controlling process variables, including
temperature, pressure, viscosity, voltage current
and more
• Electric Motors and Actuators including
alternating and direct current motors, servos,
electrical, hydraulic, and pneumatic actuators,
and more
• Electrical Relays and Industrial Control
equipment, including electro-mechanical relays,
solid state relays, motor control relays, as well
as motor control centers, programmable logic
controllers (PLC) and more
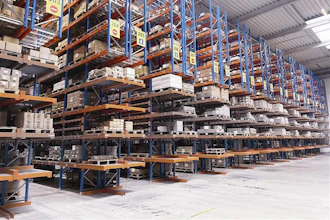
• Material Handling equipment, specifically
conveying and elevating equipment
• Industrial Robots, including those used in spot
welding, sorting, palletizing, painting and more
This report does not take into consideration exports
of services, such as those provided by systems
integrators. Nor does it account for software
solutions related to automation, such as Product
Lifecycle Management (PLM), Enterprise Resource
Management (ERM) or others. Trade data derived
from services is not readily available or consistent
across markets, and therefore, statistics used for
automation equipment could be used as a proxy
indicator for services exports. If a country is a major
recipient of U.S. equipment exports, it will likely
have associated trade in related services.
For most of the products in these sectors, their
utility lies not in stand-alone application but in
integration. A vulcanized rubber conveyor belt on its
own may be a commodity, but combined with a
servo motor and motion control within a distribution
warehouse, it becomes much more. Similarly, a PLC
may physically be an inert piece of IT hardware, but
after being connected to sensor inputs and control
outputs, however, it becomes the central nervous
system of a factory floor or food processing plant. It
becomes the lynchpin for an automated system, and
its success or failure can be extremely consequential.
Top Markets
The top 35 markets ranked in this report are
geographically and economically diverse. They
account for over 90 percent of all U.S. exports in the
industry, with a minimum threshold of $40 million in
annual exports to each market in 2015. While the
traditional markets of Western Europe figure
prominently, growth in Asia and Latin America has
been more widespread and has been strongly taking
root. For U.S. exporters, the greatest export
opportunities are not only in the largest markets.
Many other considerations may be taken into
account, including geographic and cultural proximity,
ease of doing business, tariffs and market access,
technical barriers to trade, and more. By ranking
2016 ITA Industrial Automation Top Markets Report 7
markets based on aggregate trade flows, this report
helps to account for these considerations while
offering further detailed information in the five
country case studies.
The five country case studies selected for further
reference are chosen to illustrate a variety of points.
Robust sales to Canada and Mexico, for example, are
highly dependent on geographic proximity and ease
of market access through the North American Free
Trade Agreement (NAFTA), which is now in its 21st
year of existence. Across the Pacific, Singapore is
one of the most highly developed industrial
economies in the world and is a major consumer of
U.S. automation equipment. As a free-trade partner,
market access is wide open, and sales are expected
through the future. In Brazil, a number of headwinds
that include tariffs and a slowing economy will
challenge export growth in the short term. Finally
Germany, the largest European market and top-
ranked by United Nations industrial indices, is seen
as one of the most regulated but rewarding
destinations to do business. Entering the German
market is often seen as key to entering Europe as a
whole. With automation and connectivity at the core
of the Industrie 4.0 initiative to improve
manufacturing productivity, Germany is an
important market for U.S. exporters. While these
five countries are specifically highlighted, the U.S.
Foreign Commercial Service maintains a presence in
all of the top markets ranked in this report.i
Policymakers should appreciate the different
competitiveness issues and market characteristics
that impact exporters in each sector. For more
country-specific information on local business
practices and the economic and political
environments, the U.S. Commercial Service also
provides in-depth Country Commercial Guides that
can be accessed online.ii
Industry Overview and Competitiveness
Broadly speaking, automation is the act of reducing
manual labor inputs into products or processes.
There are many reasons for automating processes.
One is the need to reduce the amount of direct labor
and decrease costs. Some tasks are truly “mindless”
and may be undesirable to even low-skilled workers.
By using automation to reduce the number of
monotonous tasks, businesses can better allocate
resources to higher value propositions, such as
research or business development. Other reasons for
automation include the needs to improve product
quality, to consistently meet exacting specifications,
or to improve speed of output. In many industrial
settings, certain tasks are also inherently dangerous
or unsanitary for human workers. Automation of
these tasks can improve occupational health and
safety outcomes while reducing the number of
worker compensation cases and costs for claims.
Today, according to a study by the McKinsey Global
Institute, as much as 45 percent of activities
individuals are paid to perform can be automated.iii
Many of the technologies that have underpinned the
move toward automation have existed for decades.
As the technologies have progressed, however, the
level of automation across any number of industrial
settings has reached unparalleled levels. In public
transit, supervisory control and data acquisition
(SCADA) systems are enabled by industrial
automation products to ensure trains and traffic
grids remain fluid and decongested. One look inside
of a major postal distribution or logistics center
reveals an almost staggering array of complexity that
is made manageable by automation. Within the food
and beverage industry, process controls are the key
to ensuring that different batches of the same soft
drink consistently look, smell and taste the same.
The United States is a top tier global supplier of
industrial automation equipment and is home to a
robust domestic industry. On one side of the
spectrum, hundreds of small to medium-sized
enterprises (SMEs) typically offer products to
compete in highly specialized equipment and
component markets. Many of these pure-play
companies are family owned and tend to focus on
particular products for specific industries or
applications. These make up the majority of
automation equipment companies.
The greatest proportion of equipment sales,
however, is generated by automation divisions of
Fortune 500 industrial conglomerates. U.S.
headquartered companies include GE (NYSE: GE),
Johnson Controls (NYSE: JCI), Emerson Electric
(NYSE: EMR), Rockwell Automation (NYSE: ROK), and
others such as Danaher Corporation (NYSE: DHR) and
2016 ITA Industrial Automation Top Markets Report 8
Honeywell International (NYSE: HON). These
companies are often structured to provide products
and services that are tailored to the unique settings
of end-use industries. With employee counts ranging
in the tens of thousands, these companies often
enjoy robust presence in major markets throughout
the globe.
The United States is also home to a large number of
automation systems integrators. These companies
are service-providers, with engineering and
production expertise, that install or integrate
automation products into existing machinery,
factory lines, warehouses and more. They typically
are certified by original equipment manufacturers
(OEMs) to work directly with end-users, and they
specialize in certain industries or applications.
Integrators tend to be SMEs that provide in-depth
expertise of local business needs and conditions, a
business model that tends to be domestically
oriented and less export-driven.
Market Drivers: End-Use Industries
The industrial automation market is tied to the
performance of end-use industries, particularly
those that rely heavily on high-volume output and
process repeatability. These include automotive,
food and beverage, metals and materials, oil and
gas, packaging, pharmaceuticals, and more.
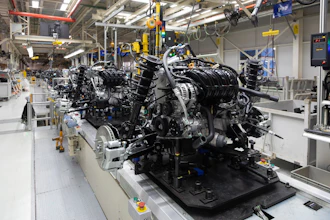
The automotive industry is one of the largest end-
use industries for automation equipment. A single
automobile can have as many as 15,000 precision
parts with a premium placed on interchangeability.iv
In 2013, 86.9 million motor vehicles were produced
around the globe with almost 76 million units
produced outside of the United States.v As a high-
volume industry focused on mass-production, the
automotive industry relies on multiple tiers of
suppliers to provide components and
subcomponents for each vehicle. From the bearings
and parts in a seatbelt locking mechanism to the
body of the car, most vehicle parts are currently
produced using highly automated machinery.
Motor vehicle assembly is also highly automated.
According to the International Federation of
Robotics (IFR), the automotive sector is the largest
end-user of industrial robotics, accounting for almost
98,900 installations in 2014.vi Most carmakers today
rely on articulated robotic arms with heavy payloads
and multiple axes of rotation to do spot-welding,
arc-welding, material handling, surface coating and
inspection. In each case, robots allow for greater
precision at a greater speed of production. The
downstream benefits in quality have made industrial
robotics a near prerequisite to any automotive
assembly operation.
In consumer goods, the food manufacturing industry
is also a major end-user of industrial automation
equipment. The market for food manufacturing is
estimated at over $750 billion in the United States
alone,vii and McKinsey estimates the global food and
agribusiness industry at $5 trillion.viii Subsectors,
such as animal feed production, sugar processing,
confections, condiments and dairy, make up an
essential industry for a growing global population.
For major manufacturers of globally branded
products, most new plants are automated in their
entirety. While large manufacturers may have the
funds to automate entire operations, many SME
processers with limited means also recognize the
value in targeting specific processes in the product
lifecycle for automation.
The same can be said for the beverage industry.
Revenue from soft drinks, breweries, wineries and
distilleries was estimated at $500 billion in 2014 in
the United States alone.ix From ingredient delivery,
mixing, bottling and secondary packaging to
distribution, the beverage industry relies on
numerous processes and steps before reaching the
consumer. As with food manufacturing, beverage
producers are often highly regulated for safety and
sanitation. In most markets, quality control is an
absolute requirement, and thus, finding solutions to
eliminate human error is a major driver in improving
operations.
There are many other end-use sectors to consider,
but the point to underscore is that virtually any
foreign manufacturer in a process-intensive industry
is a potential customer for U.S. automation
equipment. While many of these are mature
industries, what is new is the increasing degree of
scalability and drive to increase interoperability
between machinery, sensors, controllers, drives and
other equipment. As any enterprise grows to
2016 ITA Industrial Automation Top Markets Report 9
accommodate increasing productivity demands, be it
a manufacturer or utility provider, the need for
hardware and control capabilities increases as well.
As with information and communications technology
(ICT) hardware in general, the rapid pace of
improvement in speed and data processing in
industrial ICT hardware has been a major enabler of
progress across the globe. ITA expects this trend to
continue to drive sales through the short and long-
term.
Global Competitive Landscape
Relying on global trade data collected by the United
Nations Statistics Division, ITA projects that
competition will continue to come from suppliers in
Asia, Western Europe and Mexico. According to U.N.
data, in 2014, the United States was the third largest
exporter of automation equipment in the world,
behind China and Germany.x
Since 2007, China has been the largest exporter of
equipment. It has also been the fastest growing in
terms of global export market share, increasing from
11.4 percent in 2004 to 20.2 percent in 2014. The
United States, on the other hand, has seen the
largest decline over the same period, falling from
15.1 percent to 9.8 percent. Japan was the fourth
largest exporter in 2014, but it also saw a decline in
market share.
Asia
In Asia, the major competing markets are China,
Japan and South Korea. China has been the largest
producer of automation equipment for nearly a
decade. Much of this has been due to offshore
assembling for major multinational firms by contract
manufacturing companies. For example, Taiwan-
headquartered Foxconn traditionally assembles ICT
products for export into western markets. Growth,
however, is also being propelled by an increase in
domestic consumption and a drive to improve
manufacturing productivity in-country. Some
sources estimate that output within China from
Chinese-owned firms will surpass that of foreign-
owned firms by 2020.xi
In Japan, emphasis on product quality and lean
manufacturing has made the country a leading
developer and supplier of automation equipment.
Japan is well-known for revolutionizing computer-
numerical control (CNC) technology, becoming a
global powerhouse in manufacturing controls for the
machine tool industry. Japan is also well-known for
industrial robotics. While China has recently eclipsed
Japan as the leading global producer, according to
the IFR, Japan is estimated to have the largest
operational stock of industrial robots in the world.xii
Some of the country’s major industrial
conglomerates, such as OMRON, Fanuc, Yaskawa
and Mitsubishi, are diversified across robotics and
other automation products.
Korea has emerged as one of the prominent “Asian
Tigers” and is one of the top 10 producers of
automation equipment. The IFR notes that Korea
had the highest robot density in the world,xiii a point
analysts attribute largely to government actions and
initiatives.xiv
Europe
Western European companies continue to compete
tightly with U.S. companies in global markets. In
2014, the largest European exporters were
Germany, Italy, France and the United Kingdom.
In Europe, Germany is considered the leading voice
in smart manufacturing and productivity. Germany is
Europe’s largest exporter of automation equipment
by far and surpasses the United States as the second
largest in the world. Germany is home to the
Industrie 4.0 initiative, which aims to “utilize the
enormous potential of digitization… to strengthen
Germany's manufacturing base.”xv The world’s
largest automation trade show, the Hannover
Messe, draws roughly 225,000 participants each
year. Germany is home to thousands of SMEs and a
number of leading multinational corporations,
including Siemens AG and Bosch Rexroth.
Across Europe, countries, such as Italy, France and
Switzerland, are home to a number of prominent
automation companies. Companies like Schneider
Electric of France and ABB of Switzerland are leading
providers of industrial control systems. At the time
of writing this Top Markets Report, ABB is also one of
the largest industrial robotics companies to
manufacture in the United States. Italy’s Comau
2016 ITA Industrial Automation Top Markets Report 10
Group, a subsidiary of automotive giant Fiat-
Chrysler, has also produced advanced automation
systems for years.
Mexico
Mexico, like China, has traditionally been a large
market for assembling and manufacturing by major
multinational firms. Much of this trend has been
driven by the North American Free Trade Agreement
(NAFTA), Mexico’s oldest and most consequential
free trade agreement. As a result of lower labor
costs and close geographic proximity, many U.S.
multinational firms have acquired manufacturing
operations in Mexico for the purpose of eventual
resale in the U.S. market. Mexico, however, has also
entered into over 40 free trade agreements with
Japan, the European Union and others, providing
further incentive for larger multinational companies
to expand growth into the Americas.xvi
Challenges and Barriers
The International Trade Administration (ITA)
regularly engages with foreign governments to
improve outcomes for U.S. exporters.
Market Access
In the automation sector, tariffs affect many
products in a number of countries. Opening market
access through tariff reduction remains a critical
strategy for many countries, including Brazil, China,
India and more. By increasing the price of the
product for the consumer, tariffs affect the cost-
competitiveness of imported items and have
distortionary effects on the market. While tariffs
have traditionally provided a source of revenue, they
can also be used to protect politically-sensitive
domestic industries by prohibitively raising the cost
for outside competition. The United States continues
to push for open access to markets through
expansion of free trade agreements (FTA), such as
the Trans-Pacific Partnership (TPP) or the
Transatlantic Trade & Investment Partnership (T-
TIP). The United States also continues to push for
market access through established multi-lateral fora,
such as the World Trade Organization (WTO), and
bilateral fora with trade partners like China and India
through the U.S.-China Strategic & Economic
Dialogue and the U.S.-India Strategic & Commercial
Dialogue.
Content Localization
ITA also seeks to engage foreign governments on
issues of content localization. Content localization
requirements are typically set forth by governments
as a means of ensuring that a certain percentage of
inputs into a product are sourced from domestic
manufacturers. In return, the local manufacturer
may receive preferential treatment in taxation
and/or subsidies, among other incentives. For
example, Brazil gives tax reductions on and
exemptions to many industrial ICT equipment and
goods that are produced locally and qualify under
the Basic Production Process (Processo Productivo
Básico, or PPB).xvii The PPB offers incentives for the
creation and development of products with a certain
minimum amount of local content, creating barriers
for U.S. exporters.
While calls by foreign governments to increase local
content production are not in themselves barriers to
trade, they can raise concerns if they lead to actual
requirements. Similarly, in 2015, the Chinese
Ministry of Industry and Information Technology
unveiled “Made in China 2025,” an industrial policy
that intends to upgrade Chinese manufacturing
through technology and skilled labor. The plan also
calls for Chinese companies in targeted sectors to
raise domestic content to 70 percent. These priority
sectors include advanced ICT equipment, automated
machine tools, industrial robotics and power
equipment, among others.xviii While these calls are
not necessarily detrimental to trade, ITA monitors
them closely for their potential to affect U.S.
exports. Through bilateral fora, such as the U.S.-
Brazil Commercial Dialogue and the U.S.-China Joint
Commission on Commerce and Trade, as well as with
our FTA partners, ITA continues to advocate for the
same preferential treatment to be given to U.S.
exports in these sectors.
Technical Barriers to Trade
ITA closely monitors technical regulations issued by
governments and the development of standards,
which include voluntary product specifications set
forth by hundreds of regional and industry-specific
2016 ITA Industrial Automation Top Markets Report 11
standards-developing organizations (SDOs).
Oftentimes, governments will incorporate voluntary
standards set by SDOs into their regulatory regimes,
making them mandatory for their respective
markets. When regulations become overly
burdensome or have the effect of limiting imports
from otherwise qualified vendors, they can become
trade irritants and, in some cases, be classified as
technical barriers to trade (TBT).
Since 1995, the EU has mandated that all machinery
used within the 28 EU members be built to comply
with the “Machinery Directive” on safety; European
Economic Area countries (EEA, which includes
Iceland, Liechtenstein and Norway) also follow this
directive. Machinery manufacturers indicate their
compliance with this directive by placing a “CE”
marking (short for the French Conformité Européene)
on their products. The easiest means for
demonstrating compliance with the EU Directive is
to show conformity with the recognized European
Standard associated with it. Thus, to use the “CE”
marking, many manufacturers demonstrate
conformity to the appropriate standard or
standards. For U.S. producers that manufacture to
standards developed by U.S.-domiciled SDO’s, this
can require expensive changes to the product. Apart
from the direct costs of retooling and reconfiguring
models for the European market, there is
opportunity cost from the lost sales of U.S. products
that are not modified for export. As a result,
companies interested in doing business in Europe
should be well versed in the “Machinery Directive”
and its requirements.xix
While CE marking has become an understood cost of
doing business in Europe, an area long of concern to
the U.S. Government and ITA has been the EU
practice of spreading its standards regime to other
countries through the EU Neighborhood Policy (ENP)
and through European Free Trade Agreements (FTA).
The ENP consists of 16 markets in Eastern Europe,
Africa and the Middle Eastxx and is designed to
promote closer economic and political integration
with markets where the EU has strong trade ties but
that are unlikely to become EU members. As part of
the ENP or as a signatory to an FTA, countries are
often provided with aid and technical assistance to
develop their markets and, in exchange, are often
conditioned to adopt EU standards and directives.
The effect is market access barriers in many
instances for U.S. companies. Policymakers should
be aware of EU agreements with other markets that
obligate countries to withdraw from conflicting
standards.
Export Controls
The United States Government restricts the sale of
certain products and technologies to foreign
countries or persons through a broad, interagency
Export Control policy. The purpose of this policy is to
safeguard U.S. national security interests and foreign
policy objectives by limiting the sale of sensitive
equipment, software and technology. While most
U.S. products shipped to foreign markets are
innocuous and used strictly for commercial
purposes, other products may possess a “dual-use”
capability; that is, they can be used for legitimate
commercial applications but can also be used for
military or proliferation activities. As a result, the
United States Government maintains regulations in
tandem with international agreements such as the
Wassenaar Arrangement and Missile Technology
Control Regime, which lay out rules and restrictions
for exporting or releasing products to foreign
countries or persons.xxi
For industrial automation equipment, many of the
applicable licensing requirements are located in the
Commerce Control List (CCL) of the Export
Administration Regulations (EAR), which enumerates
specific items regulated by the U.S. Department of
Commerce, Bureau of Industry and Security (BIS).xxii
While the CCL enumerates specific items that
require export licenses, the EAR also contains
additional requirements applicable to most other
items, which may require licensing based on the
receiving entity (end-user) and/or the end-use of the
product. For example, further regulatory
requirements will likely apply to equipment sold for
use in creating weapons or munitions, even if the
equipment is not covered by an entry in the CCL.
Also, some exports to certain countries may require
further licensing, including both embargoed
destinations and other countries such as China, India
or Russia. BIS also maintains a List of Parties of
Concern, which enumerates individuals and entities
that may be subject to licensing requirements or
2016 ITA Industrial Automation Top Markets Report 12
whose export privileges are denied outright. Finally,
some items are not controlled by BIS but are instead
subject to regulation by another agency, which may
maintain separate licensing requirements.
While not all manufacturing technology products will
require licensing, exporters will save valuable lead-
time by familiarizing themselves in advance with the
relevant Export Control regulations and utilizing the
numerous compliance trainings that are regularly
scheduled by the Bureau of Industry and Security.xxiii
More importantly, export control violations may
carry significant repercussions, including substantial
criminal, civil and administrative penalties. Exporters
may also find local assistance through the
Department of Commerce’s network of 108 U.S.
Export Assistance Centers.xxiv
Opportunities
The global market for automation is growing. Going
into 2016, the demand for integrated and scalable
products is at an all-time high in order to meet the
growing expectations of consumers. This is not only
the case in highly-industrialized economies but also
in developing nations as many companies simply
bypass old technologies and leap-frog straight into
the trends of today. As traditional IT principles
continue to merge with manufacturing, companies
that are able to harness concepts of “digital factory”
will be at a distinct competitive advantage in their
respective industries.
U.S. automation companies are keenly aware of this
reality. Around the globe and across all industries,
the paradigm of production is shifting towards
digitization. Factories can no longer afford to run at
the “surface level." They need data collected by
sensors in order to measure throughput, systems to
provide analysis in real-time, and controls to
optimize performance.
U.S. companies are well-positioned to play a leading
role in driving technical change in the global value
chain. While the United States will continue to be a
leading innovator and market for automation
technologies, ITA is dedicated to partnering with U.S.
companies that are looking to sell overseas. With a
robust network in over 100 U.S. cities and 80
countries worldwide, ITA is a ready and able partner
in unlocking the potential of exporting.
2016 ITA Industrial Automation Top Markets Report 13
Country Case Studies
The following pages include country case studies that summarize U.S. industrial automation export
opportunities in selected markets. The overviews outline ITA’s analysis of the U.S. export potential in each
market and offer recommendations to exporters that can improve their competitiveness. The markets
represent a range of countries to illustrate a variety of points – and not the top markets overall.
2016 ITA Industrial Automation Top Markets Report 14
This Page Intentionally Left Blank
2016 ITA Industrial Automation Top Markets Report 15
Sensors and
Instruments:
2nd
Electric Motors and
Actuators:
1st
Electrical Relays and
Industrial Controls:
1st
Material Handling:
2nd
Industrial Robots:
1st
Mexico
Mexico ranks first in this Industrial
Automation Top Markets Report. With a
highly developed industrial base and
virtually zero market access barriers,
Mexico surpassed Canada in 2015 as the
largest purchaser of U.S. automation
exports. With strong growth projected
through the near and long-term, Mexico
will continue to be a strategic market for
U.S. manufacturers.
Subsector Rankings
ITA expects U.S. industrial automation exports to
Mexico will continue to increase through 2017.
Between 2009 and 2015, exports to Mexico grew at
an average annual rate (CAGR) of 10.8 percent.
Exports to Mexico have grown every year since 2009.
ITA projects that this trend will continue as Mexican
companies continue to adopt more productive and
efficient manufacturing techniques in response to
increased global demand for consumable and
durable goods.
Country Overview
Mexico is a strategic market for U.S. industrial
automation exporters. Over the past 21 years since
entering into the North American Free Trade
Agreement (NAFTA), Mexico’s economy has
increasingly oriented itself away from agriculture
and more towards an export-driven manufacturing
economy. Between 2002 and 2012, Mexican
automotive exports increased by 152 percent from
$27.9 billion to $70.3 billion, and electronics
increased by 73 percent from $43.3 billion to $74.9
billion.xxv
Mexico’s major industrial hubs are the metropolitan
areas surrounding Mexico City, Guadalajara, and
Monterrey. Mexico’s 1,900-mile shared border with
the United States has also seen an outgrowth of
industrial activity, especially as multinational
corporations aim to create vertical supply chains
made possible by NAFTA.
As a signatory of NAFTA, Mexico has virtually zero
market access barriers for U.S. exports. Mexico is a
net importer of automation products, and the
United States is Mexico’s largest import partner.
According to latest available U.N. data, in 2014, U.S.
products accounted for 43.7 percent of all imported
automation equipment into Mexico, followed by
China with 21.2 percent and Germany at 6.2 percent.
U.S. Exports:
1st
Export Growth:
8th
2012 UNIDO Industrial
Competitiveness
Ranking:
16th
UNIDO Industrial
Competitiveness
Growth Ranking:
10th
Overall Rank
1
2016 ITA Industrial Automation Top Markets Report 16
Export Overview
Mexico is the largest export market for three of the
Industrial Automation product categories. To begin,
Mexico is by far the largest destination for U.S.-
made electric motors and actuators. In 2015, Mexico
accounted for over one-fifth of all U.S. exports in the
subsector, which totaled $926 million. This was
down slightly from the $928 million total in 2014,
but average annual growth (CAGR) has been just
under 7 percent between 2009 and 2015. ITA
projects that sales in this subsector will continue to
grow.
Mexico was also the largest purchaser of U.S.-made
electrical relays and industrial controls. Not only did
Mexico receive the largest volume, totaling $472
million in 2015, but the subsector was also the
fastest growing in the Mexico market, growing at an
average annual rate (CAGR) of 21.6 percent. Growth
has been substantial in programmable controllers
(under 1,000 Volts), which totaled $197 million in
2015. This was up nearly eight times the value of
shipments in 2009. In relays of less than 60 Volts,
sales in 2015 were $84 million, up more than four
times the amount in 2009.
Industrial Robots accounted for the smallest
proportion of sales to Mexico out of the five
subsectors. In 2015, however, Mexico received the
greatest volume of all U.S.-exported robots and end-
of-arm tooling, totaling $46 million. Sales were
driven especially by parts and tooling, which typically
make up more than half of U.S. exports in the
subsector. Given Mexico’s free trade agreements
with powerhouses like Japan, home of FANUC,
Yaskawa and others, competition against U.S.
producers is particularly strong in the country. Much
of this is driven by the Mexican automotive and
consumer electronics industries, which draw heavily
from mass-produced components.
Mexico is the second largest U.S. export market for
sensors and instruments. Sales of process control
instruments and other regulating apparatuses in this
product category were $512 million in 2015. ITA
predicts that purchases from Mexico will continue to
increase through 2017, likely surpassing Canada as
the leading destination for U.S.-made products in
this category.
Sales of material handling equipment used for
automation were $279 million in 2015, making
Mexico the second largest purchaser of U.S.
$926, 41%
$512, 23%
$472, 21%
$279, 13%
$46, 2%
Figure 2: U.S. Industrial Automation Exports to Mexico, 2015
(in USD Dollars)
Electric Motors & Actuators
Sensors & Instruments
Relays & Industrial IT
Material Handling
Industrial Robots
Source: U.S. Census Bureau
Foreign Trade Division
2016 ITA Industrial Automation Top Markets Report 17
products in this subsector. Purchases of conveyors
and elevating equipment have grown significantly
between 2009 and 2015, increasing by an average of
12.9 percent per year (CAGR).
Challenges and Barriers
Mexico is a NAFTA signatory and has eliminated
virtually all tariffs on U.S. industrial automation
products. U.S. companies may provide a Certificate
of Origin to claim preferential tariff treatment for
exports under NAFTA.
The United States and Mexico continue to engage
regularly on technical barriers to trade through the
NAFTA Committee on Standards-Related Measures.
In the past they have also cooperated through the
U.S.-Mexico High Level Regulatory Cooperation
Council,
xxvii
xxviii
xxvi as well as the USAID-ANSI Standards
Alliance. Mexico provides official standards called
Norma Official Mexicana (or NOMs) as well as
voluntary standards (NMX) through the Mexican
Standards Catalog. The U.S. Department of
Commerce maintains one of four Standards Attachés
worldwide in Mexico City, and most U.S. standards
developing organizations (SDOs) are engaged with
Mexican counterparts.
Know Your Buyer
Due to its close geographical and cultural proximity
to the United States, the Mexican market is quite
similar to the U.S. market in many respects. Direct
sales and sales agents are widely used by companies
because of close proximity and low shipping costs.
Owing to the country’s geographic size, it may
behoove exporters to work with distributors in
multiple hub cities like Mexico City, Guadalajara or
Monterrey, as well as population centers along the
1,900-mile stretch of border with the United States.
Government procurement is decentralized, and
Mexican government agencies buy through their
own purchasing offices. As a result, government
tenders vary between agencies. Public tenders are
published in the Diario Oficial and are published
through an online system.xxix
National and Regional Trade Shows
[MC]2 Conference
April 19-21, 2016–Dallas, TX, USA
http://mc2conference.com/
Fabtech Mexico
May 4-6, 2016–Mexico City, Mexico
http://mexico.fabtechexpo.com/
Expo Pack Mexico
May 17-20–Mexico City, Mexico
http://www.expopack.com.mx/2016/en/expopack
$-
$100
$200
$300
$400
$500
$600
$700
$800
$900
$1,000
2009 2010 2011 2012 2013 2014 2015
Figure 3: Annual U.S. Industrial Automation Exports to Mexico, by Subsector
(In USD Millions)
Electric Motors &
Actuators
Sensors & Instruments
Relays & Industrial IT
Material Handling
Industrial Robots
Source: U.S. Census
Bureau Foreign Trade Division
2016 ITA Industrial Automation Top Markets Report 18
IMTS 2016
September 12-17, 2016–Chicago, IL, USA
http://www.imts.com/
The Assembly Show 2016
October 25-27, 2016–Rosemont, IL, USA
http://www.theassemblyshow.com/index.php
Pack Expo International
November 6-9, 2016–Chicago, IL, USA
http://www.packexpointernational.com/
Fabtech 2016
November 16-18, 2016–Las Vegas, NV
http://www.fabtechexpo.com/fabtech-2016/
TECMA
March 7-10, 2017–Expo Bancomer Santa Fé, Mexico
City, Mexico
http://www.tecma.org.mx/
Promat 2017
April 3-6, 2017–Chicago, IL, USA
http://www.promatshow.com/
FEIMAFE
June 5-10, 2017–Anhembi, São Paulo, Brazil
http://www.feimafe.com.br/en/
2016 ITA Industrial Automation Top Markets Report 19
Sensors and
Instruments:
2nd
Electric Motors and
Actuators:
1st
Electrical Relays and
Industrial Controls:
2nd
Material Handling:
2nd
Industrial Robots:
2nd
Canada
Canada ranks second overall in this year’s
Industrial Automation Top Markets
Report. Despite headwinds due to
currency exchange rates and falling oil
prices, Canada has consistently received
the highest or second-highest volume of
U.S. automation exports. With its close
proximity and shared language with the
United States, Canada will continue to be a
major destination for U.S. equipment exports.
Subsector Rankings
ITA expects that U.S. industrial automation exports
to Canada will decline through 2017. In 2015, U.S.
automation exports to Canada were over $1.9
billion. Exports to Canada decreased by 13.3 percent
between 2014 and 2015, and since 2012, they have
declined by roughly 7.1 percent annually (CAGR). ITA
attributes this primarily to the strengthening U.S.
Dollar against the Canadian Dollar. In 2012, both
currencies traded at near parity. By the end of 2015,
1USD traded for 1.38CAD, presenting significant
headwinds for U.S. exporters.
ITA also notes increased output from Mexico, with
whom Canada partners in NAFTA. Since 2009,
Mexico’s share of the Canadian import market has
increased by almost three percentage points.
Increased output from Mexico is largely a result of
deepening vertical supply chains through the NAFTA
corridor and the relative stability of exchange rate
between Canadian Dollars and Mexican Pesos.
Coupled with the U.S. currency appreciation, ITA
projects that U.S. exports to Canada will continue to
face headwinds through 2017.
Country Overview
Canada is a strategic market for U.S. automation
exporters. The country is a member of the Group of
Seven (G7) and has one of the largest and most
highly advanced manufacturing economies in the
world, which houses robust automobile, metal
fabrication, consumer goods and plastics
manufacturing industries. Canada is also one of the
five largest energy producers in the world and is the
principal source of U.S. energy imports.xxx Canada’s
proximity to the United States and status as a NAFTA
trading partner are reflected in the level of trade
already existing between the two countries. Canada
is a net importer of industrial machinery and
equipment.xxxi According to latest available U.N.
data, in 2014, U.S. automation equipment accounted
for 50.5 percent of the Canadian import market, the
largest percentage of all of Canada’s trade partners.
This was followed by China with 12.7 percent and
U.S. Exports:
2nd
Export Growth:
27th
UNIDO Industrial
Competitiveness
Ranking:
14th
UNIDO Industrial
Competitiveness
Growth Ranking:
23rd
Overall Rank
2
2016 ITA Industrial Automation Top Markets Report 20
$651, 34%
$545, 28%
$419, 22%
$271, 14%
$41, 2%
Figure 4: U.S. Industrial Automation Exports to Canada by Subsector, 2015
(in USD Millions)
Electric Motors & Actuators
Sensors & Instruments
Conveyors
Relays & Industrial IT
Industrial Robots
Source: U.S. Census Bureau
Foreign Trade Division
Mexico with 10 percent, both of which remain two
principal competitors.
Canada shares over 5,500 miles of border with the
United States (including Alaska). Approximately 90
percent of the country’s 35 million residents live
within 100 miles of the U.S. border. Manufacturing is
concentrated in Ontario and Quebec, which account
for roughly two-thirds of all manufacturing sales in
the country, followed by Alberta and British
Columbia.xxxii
Export Overview
Canada remains an important destination for U.S.
exports. In 2015, sales to Canada accounted for
nearly 18 percent of all industrial automation
exports. Since 2012, however, U.S. exports to the
country have declined by over 20 percent. In 2015,
Mexico surpassed Canada for the first time to
become the largest U.S. export market for
automation products. Currency exchange rates are
largely the cause of this trend, which have made it
more expensive for Canadian consumers to import
U.S. products. The record-low price of oil has also
created significant challenges for the Canadian
economy, with direct implications for automation
equipment exporters. Other factors include the
move of several automotive assembly lines and
engine manufacturing units out of Canada, most
notably General Motors.xxxiii
Canada is the largest export market for U.S.-made
electric motors and actuators. In 2015, this category
accounted for 34.5 percent of all industrial
automation exports to Canada. However, from 2014
to 2015, exports in this product category, including
parts, declined by 16.7 percent, which was the
greatest decline among all of the product categories.
Canada remains the second largest U.S. export
market for sensors and instruments, totaling $545
million in 2015. Sales in this category experienced a
similar drop between 2014 and 2015, falling over 16
percent. Recent developments that have contributed
to the decrease in Canadian demand include the
practical-completion of the national Smart Grid
program, which has dropped demand for metering
equipment to mainly maintenance and replacement
parts. Sales of sensors and instruments also have
been hard hit by Canada’s sagging oil and gas
industry. Downstream oil refinement relies heavily
upon process control apparatuses, and the low cost
of oil has shrunk demand significantly in this area.
2016 ITA Industrial Automation Top Markets Report 21
$-
$100
$200
$300
$400
$500
$600
$700
$800
$900
$1,000
2009 2010 2011 2012 2013 2014 2015
Figure 5: Annual Performance, U.S. Industrial Automation Exports to Canada
(in USD Millions)
Electric Motors &
Actuators
Sensors &
Instruments
Material Handling
Relays & Industrial IT
Industrial Robots
Source: U.S. Census Bureau
Foreign Trade Division
Conveyors and assorted material handling
equipment sales were $419 million in 2015,
accounting for approximately 22.2 percent of U.S.
automation exports to Canada. From 2009 to 2015,
sales in this product category increased at an
average annual rate (CAGR) of 6.7 percent, the
largest growth rate in all of the product categories.
Conveyors also experienced the smallest decline in
sales between 2014 and 2015, dropping 4.5 percent.
Unlike the previous categories described, material
handling products have been affected far less by
dropping oil prices.
In 2015, electric relays and industrial IT equipment
exports equaled $270 million, down 10.5 percent
from 2014. Controllers and other control-room
products have been affected by low oil prices,
particularly due to their wide use in Supervisory
Control and Data Acquisition (SCADA) systems across
midstream and downstream operations.
Canada was the second largest export destination
for U.S.-made industrial robots, including parts and
end-of-arm tooling. In 2015, Canada received $41
million of U.S. exports, up 6.4 percent from 2014.
Robots are primarily concentrated in the Canadian
automotive industry, which declined slightly from
2013 to 2014.xxxiv Globally, Canada is still a relatively
small market for industrial robots, adding only 2,300
units in 2014.xxxv It still remains an important market
for U.S. suppliers.
Challenges and Barriers
As a long-time free trade partner, Canada has zero
tariffs on U.S. products. Under NAFTA, U.S. goods
exports can claim preferential treatment through a
Certificate of Origin.
Technical barriers to trade are few, and Canadian
standards development is closely aligned with that
of the United States. Given their close integration,
there has been emphasis by Canadian and U.S.
standards-developing organizations to collaborate
even further to promote shared interests in
international fora.
Exporters who also provide after-market services are
advised to be well-versed in the relevant Work
Permit regulations. After-market service represents
an important revenue stream for automation
companies, and many companies are unaware of
regulations that specifically provide exceptions for
after-sales working activities. For more information,
exporters are encouraged to visit their local USEAC
or contact relevant U.S. Foreign Commercial Service
offices located in Canada.
Know Your Buyer
Sales channels in Canada vary based on the
subsector. Heavier or specialized equipment typically
go through short marketing channels, and direct
producer-to-user distribution is common. Equipment
of considerable size and value is typically purchased
2016 ITA Industrial Automation Top Markets Report 22
directly by the user, though also through distributors
and manufacturers’ agents. The Canadian
Government licenses customs brokers for importers,
and it is typically the importer’s responsibility to
arrange customs clearance. Many U.S. exporters are
unaware of the Non-Resident Importer Program,
which allows U.S. companies to register to export in
Canada without necessitating a physical
presence.xxxvi
Information about government procurement
practices is available from Public Works and
Government Services Canada.xxxvii
xxxviii
Companies
wishing to compete for government tenders can
create an account in the Supplier Registration
Information (SRI) system.
National and Regional Trade Shows
Process & Automation Shows, Canada
http://www.cpecn.com/index.cfm?id=2
Automation Expo & Conference
April 20-21, 2016 – Edmonton, Canada
http://aecalberta.ca/
[MC]2 Conference
April 19-21, 2016 – Dallas, TX, USA
http://mc2conference.com/
Montreal Manufacturing Technology Show
May 16-18, 2016 – Montreal, Canada
http://mmts.ca/
ATX- Automation Technology Canada
May 16-18, 2016 – Toronto, Canada
http://www.imts.com/
IMTS 2016
September 12-17, 2016 – Chicago, IL
http://www.imts.com/
The Assembly Show 2016
October 25-27, 2016 – Rosemont, IL, USA
http://www.theassemblyshow.com/index.php
Pack Expo International
November 6-9, 2016- Chicago, IL, USA
http://www.packexpointernational.com/
Fabtech 2016
November 16-18, 2016 – Las Vegas, NV
http://www.fabtechexpo.com/fabtech-2016/
Promat 2017
April 3-6, 2017 – Chicago, IL, USA
http://www.promatshow.com/
2016 ITA Industrial Automation Top Markets Report 23
Sensors and
Instruments:
4th
Electric Motors and
Actuators:
6th
Electrical Relays and
Industrial Controls:
4th
Material Handling:
5th
Industrial Robots:
3rd
Germany
Germany ranks third overall in this year’s
Industrial Automation Top Markets
Report. Germany is Europe’s largest
economy and a top global manufacturing
market. Germany benefits from a highly
skilled labor force and is a staunch
proponent of advanced manufacturing.
Germany is also a leading supplier of
machinery, motor vehicles, household
appliances and other manufacturing sectors.
Subsector Rankings
ITA expects that U.S. industrial automation exports
to Germany will grow through 2017. In 2015, U.S.
exports in the sector were valued at $545 million.
Germany is the United States’ largest trading partner
in Europe, and exports to Germany in the sector
grew greatly by 20.8 percent between 2014 and
2015. Germany is a leading proponent of harnessing
automation technologies to improve manufacturing
productivity, a fact most visible in the Federal
Industrie 4.0 initiative, which aims to provide
funding and resources towards “smart” factories.
Between 2009 and 2015, exports grew at an average
annual rate (CAGR) of 8.4 percent. Despite
headwinds related to currency exchange rates,
sound continued growth is expected for U.S.
automation exports to Germany.
Country Overview
Germany is the economic powerhouse of Europe. It
is the most populous European country with roughly
81 million residents, and it is the fourth largest
global economy by GDP. Germany is a major
consumer and net exporter of motor vehicles,
manufacturing machinery, electrical equipment,
rubber and plastics products, among more. The
country’s emphasis on advanced vocational
apprenticeship programs has helped to make
“German engineering” synonymous with advanced
precision manufacturing.
U.S. Exports:
4th
Export Growth:
11th
2012 UNIDO Industrial
Competitiveness
Ranking:
1st
UNIDO Industrial
Competitiveness
Growth Ranking:
23rd
Overall Rank
3
2016 ITA Industrial Automation Top Markets Report 24
$189, 35%
$152, 28%
$131, 24%
$39, 7%
$35, 6%
Figure 6: U.S. Industrial Automation Exports to Germany by Subsector, 2015
(in USD Millions)
Electric Motors & Actuators
Relays & Industrial IT
Sensors & Instruments
Material Handling
Industrial Robots
Source: U.S. Census Bureau
Foreign Trade Division
According to latest available U.N. trade data, the
United States captured 5.7 percent of the German
import market in 2014. The United States was
Germany’s seventh largest automation equipment
supplier, behind China, Hungary, Czech Republic,
Switzerland, Poland, and France. Despite being one
of the largest competing suppliers of automation
equipment, Germany remains a growing consumer
of U.S. automation exports, particularly for highly
specialized items. For many companies, entering the
German market is an important element of any
comprehensive export strategy to Europe.
Export Overview
According to the VDMA (German Engineering
Federation), Germany’s largest mechanical
engineering trade association, excitement around
the “Industrie 4.0” initiative is already beginning to
translate to increased customer expectations. In the
broadest sense, “Industrie 4.0” is the German-
government term for developing “Smart Factory”
capabilities throughout German industry by
developing cyber-physical systems. According to
VDMA, the broad publicity of this government-led
policy has already led to an increasing demand for
networked and automated solutions.xxxix
This increased demand for automation equipment
has been evident in U.S. export performance. In
2015, Germany was the third largest recipient of U.S.
industrial robots and end-of-arm tooling, accounting
for just under $35 million in sales. Competition for
industrial robots is quite high in Germany, which is
home to KUKA, as well as subsidiaries of Swiss-
owned ABB Robotics, Austrian-owned Stäubli, and
others. According to the International Federation of
Robotics, Germany had the fourth largest number of
installed industrial robots in 2014, and was the
largest in Europe. Despite Germany being the third
largest destination for the subsector, sales of
industrial robots made up the smallest proportion of
U.S. automation exports to the country in 2015.
Germany is a major consumer of electrical relays and
industrial IT equipment. As the fourth largest buyer
in this subsector, Germany accounted for almost
$152 million in sales in 2015. Much of this growth
has come from sales of programmable controllers
for industrial settings (less than 1,000 Volts), which
drew over $92 million in sales in 2015. Germany is
home to a number of competitor companies, for
example Siemens and Robert Bosch as well as
smaller multinationals such as Beckhoff Automation.
Purchases of U.S.-made controllers in Germany have
grown at an exceptionally rapid rate of 30.1 percent
per year (CAGR) since 2009. ITA expects that exports
in this subsector will continue to increase through
2017.
2016 ITA Industrial Automation Top Markets Report 25
$-
$20
$40
$60
$80
$100
$120
$140
$160
$180
$200
2009 2010 2011 2012 2013 2014 2015
Figure 7: Annual U.S. Industrial Automation Exports to Germany, by Subsector
(in USD Millions)
Electric Motors &
Actuators
Relays & Industrial IT
Sensors &
Instruments
Material Handling
Industrial Robots
Source: U.S. Census Bureau
Foreign Trade Division
Sensors and instruments are another growth
subsector. In 2015, sales were $130 million, making
it the fourth largest purchaser of U.S.-made products
in the category. Between 2009 and 2015, sales of
these products grew by 8.6 percent annually (CAGR).
Major competitors include SICK AG, Siemens Sensor
Systems, Bosch Sensortec and more. ITA expects
further growth opportunity particularly through
2017. In 2015, Germany was the fifth largest
recipient of U.S. material handling products,
including conveyors and elevating apparatuses. Sales
in this subsector were nearly $39 million. Material
handling made up a comparatively small proportion
of U.S. exports. Average annual growth (CAGR)
between 2009 and 2015 was 6.6 percent, and ITA
projects that sales will continue to grow in this
product category.
Germany was the sixth largest destination for U.S.
electric motor and actuator exporters in 2015. Sales
of the product category totaled $189 million 2015,
making it proportionally the largest U.S. category in
Germany. Between 2009 and 2015, sales of motors
and actuators had the highest combined annual
growth rate of all subsectors (10.6 percent), led
particularly by growth in electrical and electro-
hydraulic actuators. Major competitors include
Siemens, Bosch Rexroth AG, SEW Eurodrive and
others.
Challenges & Barriers
Germany maintains a highly open and transparent
business environment, and there are few formal
market access barriers. Navigating the complex
German regulatory landscape, however, can present
challenges. Regulations are heavily enforced and
applied consistently to both domestic and foreign
suppliers.
Probably the greatest challenge to entering the
German market is overcoming German electro-
technical standards and conformity assessment
procedures, which differ markedly from those in the
United States. For most electrical components such
as plugs and cables, U.S. and European standards are
nonaligned. In practice, this means that for most U.S.
machinery makers, the additional labor required to
assemble machinery for the German market will
affect pricing, inflating the price paid by the
customer while decreasing the cost competitiveness
compared with domestic and other European-made
machines. This is also true for German
manufacturers in the U.S. market, however. To date,
standards remain a controversial topic between the
U.S. Government and the European Commission,
particularly in the context of ongoing Transatlantic
Trade & Investment Partnership (T-TIP) negotiations.
To overcome this obstacle, U.S. companies are
advised to be well-versed in the relevant standards
in place for the German market.xl
2016 ITA Industrial Automation Top Markets Report 26
As part of the European Commission’s “Machinery
Directive,” machinery sold throughout the EU is
required to obtain a CE marking whenever the
product is covered by specific product legislation. CE
stands for “Conformité Européenne,” and it is
intended to demonstrate compliance with European
safety and environmental standards.
In many regards, the intense competitive nature of
the German market cannot be overlooked as a
challenge. According to a joint study by McKinsey
and VDMA, the largest German trade associations
for mechanical engineering industries, less than one
percent of German companies operate in the low-
price segment. The remainders operate in the
medium or premium-price segment, with 64 percent
identified as operating in only the premium.xli As a
result, the competitive landscape for U.S. firms is
quite stiff, and success is highly dependent on
superior quality product offerings and robust
localized customer service.
Know Your Buyer
In Germany, arguably more so than any other
country, the trade fair is critical to facilitating
commerce, especially among larger items like capital
goods. Germany is home to the world’s largest
industrial trade show, the Hannover Messe, as well
as many of the largest vertical international trade
events in the world, such as METAV and AMB. All
told, trade fairs provide near unmatched exposure in
the German market.
Germany fosters a free market system, and there are
no regulations to bind U.S. exporters to a particular
sales channel. Direct sales or indirect sales through
distributors, agents, commercial representatives and
more are the norm, and the country’s transparent
business climate make conducting due diligence
more efficient.
National and Regional Trade Shows
HANNOVER MESSE
April 25-29, 2016 — Hannover Exhibition Grounds,
Hannover, Germany
http://www.hannovermesse.de/home
Sensor + Test, Nuremberg
May 10-12, 2016 – Nuremberg, Germany
http://www.sensor-test.de/welcome-to-the-
measurement-fair-sensor-test-2016/
CeMAT – Intralogistics + Supply Chain
May 31-June 3, 2016 – Hannover, Germany
http://www.cemat.de/
Automatica – Robotics and Mechatronics
June 21-24, 2016 – Munich, Germany
www.automatica-munich.com
AMB Stuttgart
September 13-17, 2016
http://www.messe-stuttgart.de/amb/
K – Trade Fair for Plastics and Rubber
October 19-26, 2016 – Düsseldorf, Germany
http://www.k-online.com/
VISION – Machine Vision
November 8-10, 2016 – Stuttgart, Germany
www.messe-stuttgart.de/en/vision/
SPS IPC Drives
November 22-24, 2016 – Nuremberg, Germany
https://www.mesago.de/en/sps/for_visitors/welco
me/index.htm
METAV
February 20-24, 2018 – Düsseldorf, Germany
www.metav.com
2016 ITA Industrial Automation Top Markets Report 27
Sensors and
Instruments:
5th
Electric Motors and
Actuators:
9th
Electrical Relays and
Industrial Controls:
7th
Material Handling:
15th
Industrial Robots:
8th
Singapore
Singapore ranks seventh overall in this
year’s Industrial Automation Top Markets
Report. Singapore is a highly
industrialized Southeast Asian economy
and Free Trade partner with the United
States. While Singapore’s growth has
slowed in the past year due to low oil and
gas prices, the government continues to
invest in initiatives to improve
productivity and advanced manufacturing, making it a
target market for U.S. industrial automation exporters.
Subsector Rankings
ITA expects that U.S. Industrial Automation exports
to Singapore will grow moderately through 2017. In
2015, U.S. exports in the sector were valued at $351
million. This was down a slight 2.6 percent from
2014’s total of $360 million, which was the first
annual decline since the global recession in 2008.
This is largely tied to Singapore’s slowing economy,
which has been hampered by low prices of oil and
diminished Chinese demand for Singaporean
exports.xlii Between 2009 and 2015, however, U.S.
exports grew at an average annual rate (CAGR) of 11
percent. As a result, ITA expects that opportunities
will continue to grow moderately for U.S. exports to
the Singaporean market.
Country Overview
With a population of more than 5 million and half
the landmass of greater London, Singapore is among
the leading commercial and financial services hubs in
the world. It is a developed free-market economy
with one of the highest GDP per capita rates in the
world, and it is a major exporter of electronics,
machinery, pharmaceuticals, refined petroleum and
more. In 2004, the United States-Singapore Free
Trade Agreement entered into force, eliminating
virtually all tariffs on U.S. exports. The country’s
emphasis on advanced technical education at the
secondary and postsecondary levels has helped to
attract strong investment by multinational
corporations, and policies to improve production
output, such as the National Additive Manufacturing
Innovation Cluster (NAMIC), continue to reinforce
Singapore’s status as a destination for innovation
and advanced manufacturing.xliii xliv
2015 U.S. Exports:
10th
2009-2015 Export
Growth:
14th
2012 UNIDO Industrial
Competitiveness
Ranking:
2nd
UNIDO Industrial
Competitiveness
Growth Ranking:
9th
Overall Rank
7
2016 ITA Industrial Automation Top Markets Report 28
$118, 34%
$114, 32%
$90, 26%
$16, 4%
$13, 4%
Figure 8: U.S. Industrial Automation Exports to Singapore, 2015
(in USD Millions)
Electric Motors & Actuators
Relays & Industrial IT
Sensors & Instruments
Material Handling
Industrial Robots
Source: U.S. Census Bureau
Foreign Trade Division
According to latest available U.N. trade data, the
United States held 19.1 percent of Singapore’s
import market share for automation equipment in
2014, making it the largest partner that year. This
was ahead of China at 19 percent, Malaysia at 10.2
percent, and Japan at 8 percent. 2014 was the first
year since 2010 in which Singaporean automation
imports from the United States were larger than
those from China, and U.S. market share has risen
nearly 5 percentage points between 2009 and 2014.
Export Overview
In 2015, Singapore was the fifth largest recipient of
U.S.-made sensors and instruments, which totaled
$90 million in exports. Purchases have grown at a
rapid rate, growing year-on-year and averaging 17.1
percent in annual growth (CAGR) between 2009 and
2015. Process control instruments, including those
for maintaining flow and liquid levels, experienced
the greatest growth within this product category. ITA
expects that sales opportunities will continue to be
strong in this subsector through 2017.
Electrical relays and industrial IT product purchases
totaled $114 million in 2015, making Singapore the
seventh largest market for U.S. exports in this
subsector. Sales, however, decreased by 7.2 percent
in this product category between 2014 and 2015,
marking the first instance of decline since 2009.
Nonetheless, ITA projects that growth in this
subsector will continue through 2017, particularly as
key infrastructure and transportation developments
begin to take place.xlv
Despite making up a relatively small proportion of
U.S. exports to Singapore, sales of industrial robots
in 2015 totaled $13 million, making it the eighth
largest U.S. export market for the product category.
Purchases in this category typically have fallen under
replacement parts and end-of-arm tooling, owing
largely to the significant market presence of Asian
robot OEMs, such as FANUC, Yaskawa and
Mitsubishi, and more. U.S. exports of industrial
robots were the only industrial automation product
category to experience negative average annual
growth between 2009 and 2015. ITA projects
headwinds in this subsector through 2017 due to
competing Asian brands.
Exports of electric motors and actuators to
Singapore totaled $118 million in 2015.
Proportionally this was the largest subsector of U.S.
automation exports to Singapore. Singapore was the
ninth largest purchaser of U.S. exports in this
product category. Sales in this category were driven
largely by electric and pneumatic actuators, which
are commonly used with valves and taps in chemical
processing and downstream oil refinement. Sales in
this product category have declined every year since
2013, which was further indicative of the slumping
oil economy. Besides industrial robots, electric
motor and actuator sales were also the slowest
growing subsector for Singapore, averaging 6.2
2016 ITA Industrial Automation Top Markets Report 29
percent annually (CAGR). ITA projects that sales in
this subsector will continue to face headwinds
through 2017.
Singapore was the 15th largest export market in 2015
for U.S. material handling equipment, including
conveyors and elevating apparatuses. Sales to
Singapore totaled $16 million in 2015, though year-
to-year performance has been more volatile and
prone to dramatic increases and decreases. Given
Singapore’s close proximity and trade relationship
with low-cost suppliers like China and Malaysia, ITA
projects that Singapore will remain a relatively small
market for U.S. manufactured products in this
category.
Challenges & Barriers
Singapore maintains a highly open and transparent
business environment, and there are few formal
market access barriers. In fact, Singapore is ranked
first by the World Bank Group for ease of doing
business.xlvi Singapore is also ranked second in the
world by the World Economic Forum’s Global
Competitiveness Report for its commitment to
Intellectual Property protection.
In many regards, the intense competition present in
the Singaporean market cannot be discounted as a
challenge. As a destination for top foreign investors
from all across the world, competition is not local
but global.
Know Your Buyer
As the commercial hub for Southeast Asia, Singapore
is home to many agents and distributors that cover
regional and local sales. Competition is stiff, and
representatives are typically aggressive in courting
new opportunities. Given Singapore’s size, exporters
will typically find one agent or distributor to suffice
for local coverage, and a second potentially for
greater Southeast Asian operations.
National and Regional Trade Shows
Automex 2016
May 25-28, 2016 – Kuala Lumpur, Malaysia
http://www.automex.com.my/
Industrial Automation Fiesta 2016
June 8-10, 2016 – Binh Duong, Vietnam
http://vietnamindustrialfiesta.com/about-iaf-2016/
Singapore International Water Week
July 10-14, 2016 – Singapore
http://www.siww.com.sg/
Asian Robotics Week 2016
November 23-24, 2016 – Singapore
Http://robots-expo.com/
$-
$20
$40
$60
$80
$100
$120
$140
$160
2009 2010 2011 2012 2013 2014 2015
Figure 9: Annual U.S. Industrial Automation Exports to Singapore, by Subsector
(in USD Millions)
Electric Motors & Actuators
Relays & Industrial IT
Sensors & Instruments
Material Handling
Industrial Robots
Source: U.S. Census Bureau
Foreign Trade Division
2016 ITA Industrial Automation Top Markets Report 30
This Page Intentionally Left Blank
2016 ITA Industrial Automation Top Markets Report 31
Sensors and
Instruments:
9th
Electric Motors and
Actuators:
7th
Electrical Relays and
Industrial Controls:
9th
Material Handling:
4th
Industrial Robots:
10th
Brazil
Brazil ranks 12th in this year’s
Industrial Automation Top Markets
Report. Between 2009 and 2014,
exports to Brazil grew at a significant
rate. However, economic contractions
and fiscal hardships are projected
through the near term that will pose
significant challenges to growth.
Subsector Rankings
After experiencing a 6.8 percent decrease in 2015,
ITA expects U.S. industrial automation exports to
Brazil will continue to decrease through 2017. This is
largely owing to Brazil’s economic prospects, which
analysts contend have “deteriorated significantly,”
and will require significant structural changes to be
able to return to growth.xlvii Tied to this assessment
are currency exchange rates and the climbing value
of the U.S. Dollar against the Brazilian Real, which
rose over 60 percent between 2014 and the end of
2015. Despite growing efforts to increase
productivity in Brazil, given the economic challenges
of a recession, ITA projects that exports to Brazil will
continue to face headwinds in the automation
sector.
Country Overview
Brazil is the fifth largest nation in the world by area,
the sixth largest by population, and the seventh
largest economy. As the “B” in BRIC nations (Brazil,
Russia, India, China), Brazil has experienced rapid
economic growth in the immediate aftermath of the
2008 global recession. It is by far the largest South
American market. Brazil is a leading member of the
MERCOSUR southern common market, which also
includes Argentina, Paraguay, Uruguay and
Venezuela.
According to latest available U.N. trade data, the
2015 U.S. Exports:
7th
2009-2015 Export
Growth:
4th
2012 UNIDO Industrial
Competitiveness
Ranking:
23rd
UNIDO Industrial
Competitiveness
Growth Ranking:
14th
Overall Rank
12
2016 ITA Industrial Automation Top Markets Report 32
United States captured 18.1 percent of Brazil’s
import market for automation equipment in 2014,
behind China with 23.7 percent. U.S. share was
higher than Germany (11.4 percent), Italy (6.4
percent), and Japan (4.5 percent). Brazil’s economy
remains largely structured around commodity
production: agricultural products like soybeans and
coffee, textiles, chemicals, metals, and more. It is
also a regional producer of motor vehicles,
producing the sixth highest volume of autos in the
world in 2013.xlviii Brazil’s large supply of low-cost
labor has worked as a competitive advantage in
these industries. The country, however, has made
strides toward greater manufacturing and processing
productivity through automation. If it were not for
the general economic malaise, the forecast for this
Top Markets Study would remain quite positive.
Brazil’s economic conditions, however, are expected
to worsen before getting better. According to the
OECD, Brazil’s recession is forecast to continue
through 2016, and the economy is to begin its slow
recovery in 2017.xlix While Brazil will continue to rely
on U.S. machinery and automation imports, ITA
projects negative growth in the short-term.
Export Overview
Brazil was the fourth largest U.S. export market for
material handling products in 2015. Sales of
conveyors and elevating equipment equaled $42
million in 2015, which was down from a high of $71
million in 2012. Sales have decreased every year
since 2012 at an average rate (CAGR) of 16 percent.
ITA projects that this trend will continue through
2017.
Electric motors and actuators made up the largest
proportion by far of U.S. automation products sold
to Brazil in 2015. Brazil was the seventh largest
recipient of all U.S. products in this category, which
totaled $174 million in 2015. Electric motors and
actuators were the only product category to
experience growth in 2015, increasing by 26.3
percent from 2014 values. This growth is largely a
result of oil pipeline investments, retrofitting
automated valves and actuators across many
pipelines. l
$174, 47%
$82, 22%
$58, 16%
$42, 12%
$11, 3%
Figure 10: U.S. Industrial Automation Exports to Brazil, 2015
(in USD Millions)
Electric Motors & Actuators
Relays & Industrial IT
Sensors & Instruments
Material Handling
Industrial Robots
Source: U.S. Census Bureau
Foreign Trade Division
2016 ITA Industrial Automation Top Markets Report 33
$-
$20
$40
$60
$80
$100
$120
$140
$160
$180
$200
2009 2010 2011 2012 2013 2014 2015
Figure 11: Annual U.S. Industrial Automation Exports to Brazil, by Subsector
(in USD Millions)
Electric Motors &
Actuators
Relays & Industrial IT
Sensors &
Instruments
Material Handling
Industrial Robots
Source: U.S. Census Bureau
Foreign Trade Division
In 2015, Brazil was the ninth largest purchaser of
two industrial automation product categories. First,
electric relays and industrial IT hardware - the sales
of which totaled $82 million - was down from a peak
value of $109 million in 2014. Within this category,
programmable controllers of less than 1,000 Volts
made up the largest proportion of purchases and
grew steadily in spite of the broader decline. The
second, sensors and instruments, experienced the
greatest sales drop of all product categories to Brazil
from 2014 to 2015, declining 31.3 percent to a total
of $58 million. ITA expects sales of both product
categories to decline through 2016. Industrial robots
accounted for the smallest proportion of sales to
Brazil out of the five subsectors. In 2015, Brazil
received the 10th greatest volume of all U.S.-
exported robots and end-of-arm tooling, totaling $11
million. Sales were driven especially by parts and
tooling, which made up over three-quarters of
exports in the subsector.
Challenges and Barriers
Brazil maintains a number of protectionist policies
that create market access barriers to U.S. exports.
Tariffs are levied against many foreign-manufactured
automation products. Similar to a sales tax for
imported goods, tariffs are duties collected by the
government and have the effect of raising prices on
foreign goods. By raising prices, tariffs are intended
to help domestic industry maintain cost-
competitiveness against foreign producers. ITA
maintains that tariff barriers meant to protect local
industry do so at the expense of local consumers,
who ultimately pay the price through lower-quality
products. ITA continues to call on the Brazilian
government to lower tariff rates to benefit Brazilian
consumers. Exporters can find applied tariff rates
here.li
Brazil also poses a number of technical barriers to
trade. One outstanding challenge remains the
dispute over the Brazilian National
Telecommunications Agency’s requirement to test
certain ICT equipment (to include industrial IT
equipment) in Brazil rather than by independent
certification bodies.lii The unnecessary duplication in
testing and delayed time to market have been
reported by numerous U.S. companies, and ITA
continues to engage the Brazilian Government to
seek resolution. The United States and Brazil
continue to engage regularly on technical barriers to
trade. Technical regulations generally are published
in the Diário Oficial da União (the Official Gazette,
equivalent of the U.S. Federal Register), and if the
regulation is likely to affect trade, Brazil’s National
Institute of Metrology, Quality, and Technology
(INMETRO) is responsible for notifying the WTO to
allow parties to comment.
Of concern to U.S. companies is Brazil’s generally
weak record in intellectual property rights
protection. Brazil is listed in the “Watch List” of the
United States Trade Representative’s “Special 301”
2016 ITA Industrial Automation Top Markets Report 34
report for intellectual property rights (IPR)
protection.liii Brazil has fallen under the “Watch List”
category since 2007, though much of these concerns
remain over counterfeits of consumer goods and
lack of transparency in pharmaceuticals and agro-
chem products, and not necessarily in automation
equipment. The U.S. Government will continue to
press Brazil to resolve these practices.
Know Your Buyer
Brazil is by far the largest South American market,
one that dominates the surrounding regions both
economically and commercially. Automation
companies will typically partner with a local
distributor, agent or integrator to complete sales.
Companies are advised to do due diligence on local
sales representation, paying particular attention to
geographic coverage of major hubs like Brasilia, Sao
Paolo, and Belo Horizante. All importers must
register with the Secretariat of Foreign Trade
(SECEX) and comply with the computerized
documentation system called the “Sistema Integrado
de Comércio Exterior” (SISCOMEX).
Companies are advised to seek legal advice from
local counsel before establishing sales channels
within the country. For more information, exporters
are advised to review the Brazil Country Commercial
Guide or speak with a member of the U.S. Foreign
Commercial Service in Brazil.liv
National and Regional Trade Shows
FEIMEC
May 3-7, 2016 – São Paulo, Brazil
http://www.feimec.com.br/Home/
MECANICA
May 17-21, 2016 – São Paulo, Brazil
http://www.mecanica.com.br/en/
MEC Show
July 26-29, 2016 – Serra, Brazil
http://www.mecshow.com.br/site/2016/pt/home
EXPOMAC
September 21-24, 2016 – Curitiba, Brazil
http://www.expomac.com.br/
TeQ- Tecnologiaquimica
November 8-10, 2016 – Rio de Janeiro, Brazil
http://tecnologiaquimica.com.br/en/
2016 ITA Industrial Automation Top Markets Report 35
The U.S. Government has numerous resources available to help U.S. exporters: from additional market
research, to guides to export financing, to overseas trade missions, to staff around the country and the
world. A few key resources are highlighted below. For additional information about services from the
International Trade Administration (ITA), please visit www.export.gov.
Addendum: Resources for U.S. Exporters
Country Commercial Guides
http://export.gov/ccg/
Written by U.S. Embassy trade experts worldwide,
the Country Commercial Guides provide an excellent
starting point for what you need to know about
exporting and doing business in a foreign market.
The reports include sections addressing: market
overview, challenges, opportunities, and entry
strategies; political environment; selling U.S.
products and services; trade regulations, customs,
and standards; and much more.
Basic Guide to Exporting
http://export.gov/basicguide/
A Basic Guide to Exporting addresses virtually every
issue a company looking to export might face.
Numerous sections, charts, lists and definitions
throughout the book’s 19 chapters provide in-depth
information and solid advice about the key activities
and issues relevant to any prospective exporter.
Trade Finance Guide: A Quick Reference for U.S.
Exporters
http://www.export.gov/tradefinanceguide/index.asp
Trade Finance Guide: A Quick Reference for U.S.
Exporters is designed to help U.S. companies,
especially small and medium-sized enterprises, learn
the basics of trade finance so that they can turn their
export opportunities into actual sales and achieve
the ultimate goal of getting paid on time for those
sales. Concise, two-page chapters offer the basics of
numerous financing techniques, from open accounts
to forfaiting and government assisted foreign-buyer
financing.
Trade Missions
http://www.export.gov/trademissions/
Department of Commerce trade missions are
overseas programs for U.S. firms that wish to explore
and pursue export opportunities by meeting directly
with potential clients in local markets.
Trade missions include, among other activities, one-
on-one meetings with foreign industry executives
and government officials that are pre-screened to
match specific business objectives.
Certified Trade Fairs
http://www.export.gov/eac/show_short_trade_eve
nts.asp?CountryName=null&StateName=null&Indust
ryName=null&TypeName=International%20Trade%2
0Fair&StartDate=null&EndDate=null
The Department of Commerce's trade fair
certification program endorses overseas trade shows
that are reliable venues and good markets for U.S.
firms to sell their products and services abroad.
These shows serve as vital access vehicles for U.S.
firms to enter and expand into foreign markets. The
certified show/U.S. pavilion ensures a high-quality,
multi-faceted opportunity for American companies
to successfully market overseas. Among other
benefits, certified trade fairs provide U.S. exhibitors
with help facilitating contacts, market information,
counseling and other services to enhance their
marketing efforts.
International Buyer Program
http://export.gov/ibp/
The International Buyer Program (IBP) brings
thousands of international buyers to the United
States for business-to-business matchmaking with
U.S. firms exhibiting at major industry trade shows.
Every year, the International Buyer Program results
in millions of dollars in new business for U.S.
companies by bringing pre-screened international
buyers, representatives and distributors to selected
shows. U.S. country and industry experts are on site
at IBP shows to provide hands-on export counseling,
market analysis, and matchmaking services. Each
IBP show also has an International Business Center
where U.S. companies can meet privately with
prospective international buyers, prospective sales
2016 ITA Industrial Automation Top Markets Report 36
representatives, and business partners and obtain
assistance from experienced ITA staff.
The Advocacy Center
http://www.export.gov/advocacy/
The Advocacy Center coordinates U.S. government
interagency advocacy efforts on behalf of U.S.
exporters that are bidding on public-sector contracts
with overseas governments and government
agencies. The Advocacy Center helps to ensure that
sales of U.S. products and services have the best
possible chance competing abroad. Advocacy
assistance is wide and varied but often involves
companies that want the U.S. Government to
communicate a message to foreign governments or
government-owned corporations on behalf of their
commercial interest, typically in a competitive bid
contest.
U.S. Commercial Service
http://www.export.gov/usoffices/index.asp
With offices throughout the United States and in
U.S. Embassies and consulates in nearly 80 countries,
the U.S. Commercial Service utilizes its global
network of trade professionals to connect U.S.
companies with international buyers worldwide.
Whether looking to make their first export sale or
expand to additional international markets,
companies will find the expertise they need to tap
into lucrative opportunities and increase their
bottom line. This includes trade counseling,
actionable market intelligence, business
matchmaking, and commercial diplomacy.
2016 ITA Industrial Automation Top Markets Report 37
Appendix 1: Methodology
To establish a priority of foreign markets that offer best prospects for U.S. producers of industrial automation
equipment, this report identified four criteria that were weighted according to perceived relevance. These criteria
were:
• total volume of U.S. industrial automation exports in 2015, as measured by U.S. Census Bureau Foreign Trade
Division (50%);
• compound annual growth rate (CAGR) of U.S. industrial automation exports between 2009 and 2015, as
measured by U.S. Census Bureau Foreign Trade Division (20%);
• most up-to-date ranking (2012) of market by United Nations Industrial Development Organization (UNIDO)
“Competitive Industrial Performance Index” (15%); and
• level of growth in industrialization as measured by rate of improvement in 2009-2012 UNIDO “Competitive
Industrial Performance Index” rankings (15%).
To determine total volume and annual growth of U.S. industrial automation exports, ITA identified 77 unique 10-
digit Schedule B codes. “Schedule B” codes are those used by U.S. exporters to declare their products for export,
and thus reflect the dollar value of items as reported to the U.S. Census Bureau Foreign Trade Division. Domestic
exports are goods that are grown, produced or manufactured in the United States. They are also commodities of
foreign origin that have been changed in the United States or in a U.S. Free Trade Zone, including changes that
were made from the form in which they were imported, or that have been enhanced in value or improved in
condition by further processing or manufacturing in the United States.
In ranking markets, ITA placed the most emphasis on total volume of exports in 2015. It is presumed that markets
with historically high U.S. exports will continue to be so in the future for a variety of reasons. Historic export trends
indirectly take into account factors specific to the United States, such as geography, Free Trade Agreements (FTA)
and size of market opportunity.
As the subject of this report implies, use of industrial automation equipment is predicated on a level of
industrialization in the target market. Industrialization is understood to cover a wide range of social and economic
activities within a society. The United Nations Industrial Development Organization (UNIDO) “Competitive
Industrial Performance” Index (CIP) is a composite index that consists of sub-indicators of industrial
competitiveness. It is presumed that the greater the value of a country’s CIP ranking, the more likely that country
will house a market for industrial automation products. Likewise, it is presumed that countries experiencing
growth over time in their CIP ranking will represent growing demand for industrial automation products.
It should be noted that the 2015 Industrial Automation Top Markets Report focuses on physical equipment
exports. It does not take into account exports of accompanying software solutions, such as product lifecycle
management (PLM), enterprise resource management (ERM), Manufacturing Execution Systems (MES), product
visualization or other software. It also does not take into account services, such as those provided by third party
systems integrators, distributors or consultants. While services undoubtedly play an important role in this sector,
precise export data on industrial automation software and accompanying services is neither readily available nor
consistent across markets. It is presumed that a country that imports a high volume of equipment will likely have
associated trade in related services; therefore, trade statistics for equipment can be used as a proxy indicator for
services.
2016 ITA Industrial Automation Top Markets Report 38
Market
2012
Industrial
Performance
Industrial
Performance
Growth: 2009
to 2012
2015
Merchandise
Exports
Merchandise
Export Growth,
2009 to 2015
Total
Score
Weights: 0.15 0.15 0.5 0.2 1
Mexico 31 50 100 19 66
Canada 38 42 86 4 56
Germany 100 43 22 14 35
China 62 69 28 6 35
Poland 29 50 2 100 33
Japan 88 54 12 12 30
Singapore 58 63 14 21 29
Korea 73 55 15 7 28
Netherlands 56 44 12 35 28
Vietnam 6 90 0 62 27
United Kingdom 48 43 17 12 25
Brazil 15 50 15 32 24
Saudi Arabia 15 94 5 4 20
Taiwan 52 57 3 7 19
Thailand 4 100 1 17 19
Ireland 52 26 2 28 19
Colombia 29 50 2 26 18
Norway 60 39 0 5 16
India 52 26 5 4 15
Italy 52 26 4 6 15
Russia 17 68 1 5 14
Peru 25 50 0 12 14
Australia 21 37 8 4 13
France 10 50 5 7 13
Switzerland 12 50 0 18 13
Belgium 52 26 1 1 12
Argentina 12 50 1 12 12
Spain 35 25 2 7 11
Venezuela 8 50 3 2 10
Chile 6 50 3 3 10
United Arab Emirates 8 25 4 13 9
Israel 21 25 1 8 9
South Africa 10 28 0 4 7
Malaysia 2 10 2 0 3
Hong Kong 0 0 3 3 2
2016 ITA Industrial Automation Top Markets Report 39
Appendix 2: Notes and Citations
i Note: Switzerland and Venezuela are “Partner Posts,” meaning export promotion and commercial responsibilities are
delegated to the State Department in the Economic Section of the U.S. Embassies in Bern and Caracas, respectively.
ii http://www.export.gov/ccg/
iii Michael Chiu, James Manyika, Mehdi Miremadi. “Four Fundamentals of Workplace Automation” McKinsey Quarterly,
November 2015.
http://www.mckinsey.com/insights/business_technology/four_fundamentals_of_workplace_automation
ivKlier, Thomas, and James Rubenstein. 2008. "The Parts of Your Vehicle." In Who Really Made Your Car?: Restructuring and
Geographic Change in the Auto Industry. Kalamazoo, MI: W.E. Upjohn Institute for Employment Research, pp. 1-30
v Alan K. Binder, ed. “Ward’s Automotive Yearbook 2014” Ward’s Automotive Group (Southfield, MI)
vi http://www.ifr.org/industrial-robots/statistics/
vii Gale Business Insights Global - dollar value calculated through aggregating revenues of industries falling under NAICS 311,
“Food Manufacturing”.
viiiLutz Goedde, Maya Horii, Sunil Sanghvi. “Pursuing the global opportunity in food and agribusiness” McKinsey & Company, July
2015 http://www.mckinsey.com/insights/food_agriculture/pursuing_the_global_opportunity_in_food_and_agribusiness
ix Gale Business Insights Global- dollar value calculated through aggregating revenues of industries falling under NAICS 3121,
“Beverage Manufacturing”.
x This data reflects global exports between countries and should not be taken to indicate total levels of output for export and
internal consumption. For example, countries like Germany rely heavily upon exports, while less is consumed in the domestic
markets. For countries like the United States that are significantly larger in size and population, most of production is consumed
internally, with less reliance on exporting.
xi Georg Stieler “Industrial Automation in China” Automation.com, July 2015
http://www.automation.com/automation-news/article/industrial-automation-in-china
xii http://www.ifr.org/industrial-robots/statistics/
xiii Ibid.
xiv John Edwards “The Quiet Giant of Asian Robotics: Korea” Robotics Business Review, May 2014
http://www.roboticsbusinessreview.com/article/the_quiet_giant_of_asian_robotics_korea
xv German Federal Ministry of Economic Affairs and Energy (BMWi) http://www.bmwi.de/EN/Topics/Economy/Industrial-
policy/industrie-4-0.html
xvi M. Angeles Villarreal “Mexico’s Free Trade Agreements” Congressional Research Service. July 3, 2012.
https://www.fas.org/sgp/crs/row/R40784.pdf
xvii United States Trade Representative “2015 National Trade Estimate Report on Foreign Trade Barriers” p. 43.
https://ustr.gov/sites/default/files/2015%20NTE%20Combined.pdf
xviii Scott Kennedy “Overview: Made in China 2025” Center for Strategic & International Studies, June 1, 2015.
http://csis.org/publication/made-china-2025
xix http://ec.europa.eu/growth/single-market/european-standards/harmonised-standards/machinery/index_en.htm
xxhttp://eeas.europa.eu/enp/index_en.htm
xxi http://www.wassenaar.org/
xxii https://www.bis.doc.gov/index.php/regulations/commerce-control-list-ccl
xxiii http://www.bis.doc.gov/index.php/compliance-a-training/current-seminar-schedule
xxiv http://export.gov/eac/index.asp
xxv http://www.forbes.com/sites/stratfor/2015/04/08/mexicos-manufacturing-sector-continues-to-grow/
xxvi http://trade.gov/hlrcc/
xxvii http://standardsalliance.ansi.org/
xxviii http://www.economia.gob.mx/standards/mexican-standards-catalog
xxix https://compranet.funcionpublica.gob.mx/web/login.html
xxx https://www.eia.gov/beta/international/analysis.cfm?iso=CAN
xxxi Economist Intelligence Unit Canada Country Report
xxxii http://www.statcan.gc.ca/tables-tableaux/sum-som/l01/cst01/manuf28-eng.htm
xxxiii http://www.theglobeandmail.com/report-on-business/international-business/us-business/gm-to-end-oshawa-camaro-
production-nov-20/article24186829/
xxxiv Alan K. Binder, ed. “Ward’s Automotive Yearbook 2014” Ward’s Automotive Group (Southfield, MI). p. 97
xxxv http://www.ifr.org/industrial-robots/statistics/
2016 ITA Industrial Automation Top Markets Report 40
xxxvi Tracey Ford “Canada: the Non-Resident Importer Program” U.S. International Trade Administration, July 2015
http://files.export.gov/x_2425843.pdf
xxxvii http://www.tpsgc-pwgsc.gc.ca/app-acq/index-eng.html
xxxviii https://srisupplier.contractscanada.gc.ca/index-eng.cfm?af=ZnVzZWFjdGlvbj1yZWdpc3Rlci5pbnRybyZpZD03
xxxix Juliane Friedrich “Growth for German Intralogistics Providers in 2015” VDMA February 23, 2016.
http://foerd.vdma.org/article/-/articleview/12176609
xl See Germany Standards Regime
xli McKinsey/VDMA “The Future of German mechanical engineering”, pg. 28
xlii Michael Lingenheld “Slowdown in Singapore” Forbes, 13 August 2015.
http://www.forbes.com/sites/michaellingenheld/2015/08/13/slowdown-in-singapore/#43e020ba6b67
xliii http://www.spring.gov.sg/NewsEvents/ITN/Pages/Launch-of-cluster-heralds-exciting-new-chapter-in-3D-printing-for-Spore-
20150923.aspx
xliv Kelly Tay, Andrea Soh “Beyond 50: Singapore’s growth strategy shifts” The Business Times, 11 August 2015
http://www.iesingapore.gov.sg/Media-Centre/News/2015/8/Beyond-50--Singapore-s-growth-strategy-shifts
xlv Lee U-Wen “Singapore Budget 2015: Infrastructure spending to grow by 50% to reach S$30Billion” The Business Times, 23
February 2015
http://www.businesstimes.com.sg/government-economy/singapore-budget-2015/singapore-budget-2015-infrastructure-
spending-to-grow-by-50
xlvi http://www.doingbusiness.org/rankings
xlvii Kenneth Rapoza “Brazil’s Economy Hasn’t Been This Bad Since 1930” Forbes, 14 January, 2016
http://www.forbes.com/sites/kenrapoza/2016/01/14/brazils-economy-hasnt-been-this-bad-since-1930/#7d33d3437dba
xlviii Alan K. Binder, ed. “Ward’s Automotive Yearbook 2014” Ward’s Automotive Group (Southfield, MI), pg. 6
xlix http://www.oecd.org/eco/outlook/brazil-economic-forecast-summary.htm
l Michael Place “Brazil unveils US$53bn energy investment plan” BNAmericas, 11 August, 2015.
http://www.bnamericas.com/en/news/electricpower/brazil-unveils-us53bn-energy-investment-plan1
li https://www.wto.org/english/thewto_e/countries_e/brazil_e.htm
lii United States Trade Representative “2015 National Trade Estimate Report on Foreign Trade Barriers: Brazil” pg. 39.
liii United States Trade Representative “2015 Special 301 Report”, pg. 71
liv http://www.export.gov/ccg/brazil090732.asp
U.S. Department of Commerce | International Trade Administration | Industry & Analysis (I&A)
Industry & Analysis’ (I&A) staff of industry, trade
and economic analysts devise and implement
international trade, investment, and export
promotion strategies that strengthen the global
competitiveness of U.S. industries. These initiatives
unlock export, and investment opportunities for U.S.
businesses by combining in-depth quantitative and
qualitative analysis with ITA’s industry relationships.
For more information, visit
www.trade.gov/industry
I&A is part of the International Trade Administration,
Whose mission is to create prosperity by
strengthening the competitiveness of U.S. industry,
promoting trade and investment, and ensuring
fair trade and compliance with trade laws and
agreements.
Top Markets Report: Industrial Automation
This International Trade Administration Top Markets report attempts to provide guidance to companies and U.S. government trade agencies by assessing and ranking foreign markets based on export potential. Based on trade data and global industrial indices, along with market intelligence from U.S. Foreign Commercial Service Officers, our rankings represent the best current understanding of market opportunities. The report also provides exporters with detailed assessments of selected markets by providing five country case-studies: Brazil, Canada, Mexico, Germany and Singapore.
Latest in Home

Sponsored
Fixing Congested/Underutilized Loading Docks
June 22, 2026

Wesco Names Gulf Region Leader
June 23, 2026


Cutting Tool Shipments Up 21% in April
June 23, 2026
Fill out the form below to request more information about Top Markets Report: Industrial Automation