Industrial Distribution’s Survey of Distribution Operations is now in its eighth decade, and for all that changes with each iteration, so much also remains the same.
This year, we deployed our comprehensive questionnaire in late March, so our responses will reflect a very unique context: the economy was plummeting at a shocking rate, and many respondents were likely still digesting the impacts to both their lives and businesses.
So this consideration must be acknowledged, and the results may reflect some shaken confidence, whether temporary or otherwise. Despite this, the business environment leading up to COVID-19 was very truly a mixed bag for many companies, so as we attempt to extrapolate trends, we realize that the experience for industrial distributors in this fragmented and highly unique market is a specialized one, this and every year.
As always, the coming pages will examine seven main categories:
- Demographics — establishes a profile of survey respondents based on company size, years in business, sales volume and product line
- Challenges, Trends & Economy — outlines the initiatives distributors are undertaking to address key business and market concerns, as well as mergers and acquisitions and how distributors view the impact of the economy
- Tech Usage & Investments — covers areas like e-commerce and other big-impact technology solutions for now and the future
- The Balance Sheet — offers insights into revenues and profitability, addressing areas of investment, concern and other analysis of factors impacting revenue
- Best Practices — sheds light on distributor relationships with suppliers and customers, as well as their global business plans and what challenges are involved
- Value of the Distributor — addresses the reasons our survey respondents believe customers do business with them, and which service offerings play a significant role in the industry
- Employment — identifies hiring and layoff trends, recruitment and compensation
Part 1 covered Demographics; Challenges, Trends & Economy; and Tech Usage & Investments. Here in Part 2, we'll cover The Balance Sheet; Best Practices; Value of the Distributor; and Employment.
The Balance Sheet
Like with the Great Recession of 2008-2009 and the oil & gas downturn of 2014-2015, a market-wide disruptor skews the results of this year’s survey questions that pertain to distributors’ sales and profits compared to less volatile years. Factory and business shutdowns in response to the COVID-19 pandemic cut off significant business to many distributors this spring, and with plenty of publicly-traded suppliers noting drastic reductions in capital spending for the rest of 2020, we can expect to see downtrodden earnings reports for at least the next couple fiscal quarters.
Making matters worse, the pandemic is coupled with an underlying weakened demand for industrial products that has persisted since mid-2019. So, even if there was no virus to worry about, many balance sheets in the industrial products sector would still be sluggish on a year-over-year basis.
Asked how their sales have fared over the past year compared to a year prior, 46 percent of our 2020 respondents said sales increased, sinking from 62 percent who said so in 2019 and 73 percent in 2018. Thirty-two percent of this year’s respondents said sales decreased compared to a year ago, while 22 said they’ve stayed about the same. Each of those respective percentages are within 2 percentage points when asked about how profits have fared.
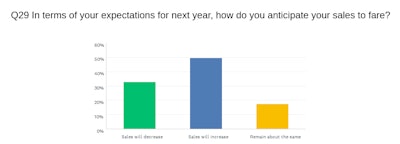
Looking ahead, just shy of 50 percent of our crop of distributor respondents expect sales to increase over the next year, compared to 76 percent who said so last year and 87 percent in 2018. Almost one-third of 2020 respondents expect sales to decrease and 18 percent think sales will remain about the same.
In a period where many distributors plan to curtail spending, how are they planning to grow their business? It’s likely that many just hope to tread water until the economy fully recovers, while other proactive distributors may see a suddenly-weakened economy as an opportunity to gain market share. Asked what tactics they’re considering for growth and business development, “Advertising/marketing” was chosen by 51 percent of respondents, ahead of all others. That’s somewhat of a surprise, given that marketing spending is often one of the first areas of reduction for many businesses during troubling financial times. That percentage is still down from a recent high of 63 percent who picked it last year, but it’s this year’s top tactic nonetheless.
With most distributors closing public access to their brick-and-mortar stores during the pandemic, many have pivoted to emphasizing e-commerce sales. Forty-eight percent of our respondents picked “Sell more via e-commerce” as one of their top growth tactics, followed closely by “Drive traffic to website” as the third-most chosen option at 45 percent.
Distributors could write in additional growth strategies, and one respondent said “focus on public safety” — a product area that certainly seems worth investing in going forward with COVID-19’s aftermath.
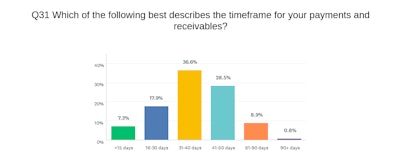
The economic slowdown also shows up when asked for respondents’ timeframe for payments and receivables. Chosen by 37 percent, 31-40 days was the most common, followed by 41-50 days at 28 percent. That’s quite a shakeup compared to last year’s top choice of 16-30 days.
Best Practices
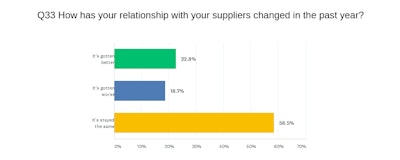
This year’s survey respondents suggested that their relationships with suppliers are on the decline. In our 2018 report, 36 percent of respondents said their relationships with suppliers had improved over the past year, compared to 23 percent who said the same this year. In fact, nearly as many (19 percent) in our 2020 response pool said their relationships had actually gotten worse. This compares to 11 percent who said the same in 2018.
So what could be driving this dissatisfaction? Several respondents elaborated, with one saying that the suppliers “are becoming much less concerned with relationships and more concerned with growth.” Another said their supplier(s) “are trying to accommodate Amazon and diverting attention” away from other partners. Other complaints ranged from poor service, unqualified sales reps and unreliable shipping.
Issues with supplier support levels are so widespread that more respondents said they have gotten worse (28 percent), compared to 20 percent who say they’ve gotten better over the past year. In our 2018 report, 23 percent said it had gotten better over the previous year.
And while terms and support issues net the lion’s share of the complaints, they aren’t necessarily deal breakers. That’s because our respondents suggest their priorities when evaluating their suppliers lie primarily with quality and on-time delivery.
Additionally:
- A whopping 89 percent of survey respondents said that their suppliers have raised prices in the last year. This is consistent with years past, and the vast majority of distributors say they contend with price increases each year. 43 percent of respondents say they consider price to be among their top priorities when evaluating a supplier.
- Distributors say their partners are mitigating these pricing issues by offering new production introductions (36 percent); reduced shipping rates (29 percent) and co-op marketing (28 percent). Far fewer (13 percent) say they are able to negotiate price reductions. A large number of respondents said no efforts were being taken to help offset the price increases, with one adding their suppliers “don’t seem too concerned with my costs.”
- 22 percent of our respondents currently install/maintain vending machines at customer sites. For those who don’t, the majority don’t intend to enter this service offering, with 13 percent saying they planned to pursue vending services.
Value of the Distributor
As sellers of similar products that are often considered commodities in the industrial space — fasteners, hand tools, cutting tools, PVF and PPE — it’s often in services that distributors aim to distinguish themselves from one another, manufacturers selling direct and e-commerce marketplaces like Amazon.
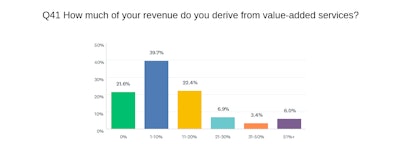
For a small portion of our respondents — 9 percent — value-added services comprise more than 30 percent of their total revenue. That’s reason enough for those distributors to put as much effort into excelling at least as much with those services as in product sales. Twenty-nine percent of our respondents derive between 11-30 percent of overall revenue from services, while less than 22 percent of respondents say they get no revenue from services. Overall, those percentages were quite similar to a 2019’s.
Which services are distributors charging a fee for? Shipping will likely always top the list for our respondents, chosen by nearly 80 percent of them this year. That figure is up 13 percentage points over 2019, however, perhaps a sign that more distributors are charging for shipping amid a weakened industrial economy that would when selling conditions are better. Our respondents’ second-most popular service they charge for is setup/installation at 30 percent; followed by design/engineering consulting (18 percent), fabrication/kitting (17 percent) and inventory management (15 percent).
Speaking of inventory management, 48 percent of respondents indicated they are involved in vendor-managed inventory programs. That figure has hovered in the upper 40s in recent years, with a recent high of 51 percent in 2016. Given the overall rise of VMI over the past decade and the growing number of VMI solution providers, it’s a little surprising to see our survey figure for VMI involvement hasn’t steadily increased. It will be interesting to see next year’s percentage, however, as COVID-19 may encourage more distributors to invest in such a program as a way of reducing face-to-face exposure between their personnel and customers.
We also asked our respondents what their level of involvement is with distributor co-operatives and buying groups — entities that help provide smaller, independent distributors the collective buying power needed to compete with national distributors. Forty-five percent said they have some level of involvement, nearly the same as last year and far above the 34-42 percent range this question resulted in from 2013-2018.
Employment
Despite an influx of Millennials and now Gen-Z aged employees in recent years, industrial distribution is still largely a Baby Boomer-driven industry, at least at the executive and decision-maker level. Distributors, associations and co-ops/buying groups are putting forth commendable effort to appeal to a younger workforce, but it’ll likely always be tough-sledding compared to ‘sexier’ industries.
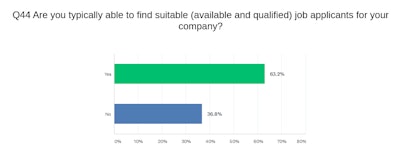
Asked if they are typically able to find suitable job applicants for their company, almost 37 percent of our distributor respondents said no. That’s actually an improvement from 2019 and is consistent with recent years. Notably, our 2011 survey found that only 28 percent weren’t able to find suitable talent — helping illustrate that it’s become progressively harder for distributors to recruit over the past decade.
Ranking themselves on a five-point scale of “poor” to “excellent”, most of our respondents put themselves at “fair” (34 percent) or “good” (37 percent), with about 25 percent rating themselves as “very good” or better. Thankfully, only 3 percent rated themselves as poor in this area.
ID news during April and early May was led by distributor and supplier earnings reports that detailed significant staff reductions or company-wide pay cuts as cost-savings measures to cope with COVID-19. Whereas 56 percent of our 2019 respondents said they added staff in the previous 12 months, that figure fell to 40 percent this year. Almost 20 percent said they already reduced staff in the past year (11 percent in 2019), while more than 22 percent expect to trim headcount in the year ahead. It should be noted that our survey was open throughout the first three weeks of April. It’s likely that if the survey were taken right now, the percentages of those who have made job cuts would be higher.
For those distributors that have added staff, 63 percent indicated additions were made in sales, followed by the warehouse at 33 percent and customer support at 32 percent. For those who have reduced staff in the past year, respondents picked a fairly even split among the top areas where those cuts were made: 35 percent picked sales, followed by 31 percent each for warehouse and administration. Operations, customer support and clerical each were chosen by 14 percent of respondents, while 12 percent said they’ve made cuts to all the above.
Other stats from this section:
- Only 14 percent of respondents said they’ve had to reduce their employees’ overall benefits package in the past year. This is notable, given that many large distributors and suppliers said during April and May that they’ve had to pause matching their employees’ 401(k) contributions. For context, a decade-low 5 percent of 2018 respondents said they had to reduce benefits.
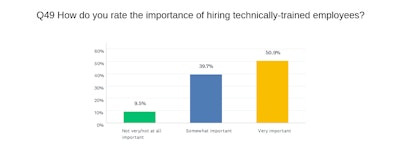
- 51 percent of respondents rated hiring technically-trained employees as “very important”, with 40 percent saying it’s “somewhat important” and less than 10 percent saying “not important at all.” It’s a modest shift from 59 and 58 percent who picked very important in 2019 and 2018, respectively, perhaps evident of a rise in “culture-based” hiring in the industrial sector. One respondent noted that they definitely require a technical background for sales engineers, while the company can train other staff positions for technical skills.
- Respondents’ top choice for methods to retain employees was higher pay at 79 percent — up 12 percentage points from 2019 and the highest such figure in recent years. “Improved benefits package” was the second-most chosen tactic at 50 percent, followed by “training” (37 percent) and “invest in technology (23 percent).
A Penny for Your Thoughts...

- “Housing costs reduce availability of new employees.”
- “Only one: Coronavirus with hope can get back to the positive side of the business in all respects/aspects.”
- We are classified as “Essential,” so we’re open, but many customer plants are closed or have reduced staff. Service crews are no longer allowed in plants. Some suppliers are closed. Accounts receivable is slowing rapidly.”
- “Price-gouging glove importers.”
- “Remove the Trump tariffs as a way to stimulate more profitable business for the entire supply chain from sources in China though clear end-user pricing.”
- “Political approach to trade has been extremely detrimental with no choices in the future. COVID-19 will now cause a major delay in our business plans to grow.”
- “NEED TO BREAK-UP AMAZON.”
- “Everything was going good until March when COVID-19 hit. If this occurred before March, many of my answers would be different. Tough to tell right now what the balance of the year looks like.”
- “Coronavirus is having an extremely deleterious effect on all facets of our business.”
- “With COVID-19 ongoing, every distributor is affected in some way.”
- “Internet purchasing is a big challenge since we are a solution-based distributor. Once we demo a product with an operator and receive buy-in on the solution, the purchasing agent obtains our quote and sources it to the lowest online source. Manufacturers that we partner with are struggling to find ways to combat this in order to retain traditional local distributor/manufacturer relationships for future opportunities. In the end, both local distributor sales rep and manufacturer sales rep lose commission and confidence in partnering to grow sales and lead to strained relationships.”
Methodology
Results of this study are based on an email survey sent to Industrial Distribution subscribers. Recipients of this survey were offered an incentive to complete the questionnaire.
Industrial Distribution’s subscriber base is comprised of 27,000 readers, the majority of whom identify as upper management (executive level managers or company owners). The remainder of the subscriber base identifies as sales or sales management. Results are based on a pool of respondents within this subscriber base.


