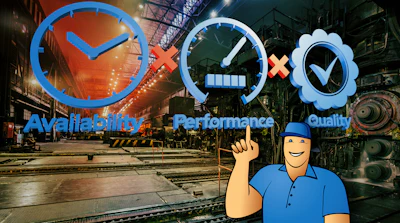
Overall Equipment Effectiveness is a manufacturing KPI built from three factors: availability, performance, and quality. The formula is:
OEE = Availability × Performance × Quality
In simple terms, OEE shows how much of your planned production capacity turns into good output. A machine with 100% OEE would run whenever scheduled, at its ideal speed, while producing only good parts. In reality, downtime, slow cycles, changeovers, setup issues, scrap, rework, and minor stops all reduce the final score.
A high OEE score means equipment is being used efficiently. A low score does not just show underperformance; it helps show why.
What is a good OEE score?
OEE benchmarks vary by industry and production model. In general, 85% or higher is considered world-class, while many manufacturers operate between 60% and 85%. Scores between 40% and 60% point to major improvement opportunities, and anything below 40% suggests serious efficiency problems.
However, generic benchmarks can mislead. A continuous 24/7 operation may aim for 85% or more. A high-mix, low-volume manufacturer with frequent changeovers may operate at a lower OEE even when well managed. For most companies, the best target is steady improvement from their own baseline.
The three parts of OEE
Availability measures whether equipment was actually running during planned production time. It is calculated as runtime divided by planned production time. Availability losses include setup, changeovers, tooling changes, calibration, cleaning, warm-up time, breakdowns, and unexpected maintenance.
Performance measures whether the machine ran at its ideal speed while operating. It compares actual output with the theoretical maximum output possible during runtime. Performance losses come from slow cycles, idling, small jams, short stops, and reduced operating speed. The key is to choose a realistic but consistent standard for ideal speed.
Quality measures how much of the total output was usable. It is calculated as good parts divided by total parts produced. Quality losses include defective parts, scrap, rework, and startup losses while equipment is being adjusted or brought up to stable production.
Together, these three pillars show whether capacity is being lost to downtime, speed, or defects.
How OEE is calculated
Imagine a production line with 90% availability, 80% performance, and 95% quality. Its OEE would be:
90% × 80% × 95% = 68.4%
This means the line produced 68.4% of its theoretical good output. The rest was lost through downtime, slower-than-ideal running, defects, or a mix of all three.
A more detailed example could start with a 10-hour shift, or 600 minutes. After a 30-minute break, planned production time is 570 minutes. If setup, breakdowns, and adjustments take 105 minutes, runtime falls to 465 minutes, giving availability of 81.6%. If the machine produces 204 units when its ideal cycle time suggests more could have been made, performance may be 87.7%. If 196 of those 204 units pass inspection, quality is 96.1%. Multiplied together, OEE is 68.8%.
This kind of result is not unusual, but it shows where improvement work should begin.
OEE vs. TEEP
OEE measures how effectively scheduled production time is used. Total Effective Equipment Performance (TEEP) goes further by measuring equipment effectiveness against all available calendar time, including nights, weekends, and holidays. OEE is useful for improving current production. TEEP is better for capacity decisions, such as adding shifts or investing in new equipment.
How to improve OEE
The first step is honest data. OEE loses its value when teams change definitions to make results look better, ignore rework, underreport downtime, or use it to blame operators. The goal is to reveal losses clearly enough to fix them.
If OEE is below 60%, start with machine reliability, breakdowns, and preventive maintenance. If it is between 60% and 75%, look for hidden losses such as minor stops, inefficient changeovers, and startup scrap. If it is above 75%, focus on consistency, standardization, and careful speed improvements without sacrificing quality.
Manufacturing software like MRPeasy can make OEE tracking easier by collecting shop-floor data and turning it into real-time reports. But software alone does not improve OEE. The real value comes from using accurate data to identify losses, act on them, measure progress, and repeat the process continuously.
For more information, visit www.MRPEasy.com.