We’re excited to provide the readers of Industrial Distribution with the results of our 69th Annual Survey Of Distributor Operations. The objectives of this report, as always, have been to understand the most critical issues affecting distributors, and to provide data to help drive their educated business decisions. Through these findings, we’ll discuss new and ongoing industry trends and what trends have fizzled. How has the ongoing industrial recession impacted distributors? Read on to find out.
In this first online segment, we focus specifically on Demographics, which establishes a profile of survey respondents based on company size, years in business, sales volume and product line.
As expected, the vast majority of our Survey of Distributor Operations respondents are MRO products distributors. Nearly 83 percent say they sell to the manufacturing/ processing market, just a hair lower than last year. Construction is again the second-largest market, up less than a percentage point from 2015 at 63.6 percent, while at 60.2 percent, the share of OEM market sellers was third-largest and down two percentage points from a year ago. Machine shops, energy and utilities market sellers each represented between 50 and 58 percent of respondents, all within a point or two of last year, while government market sellers had a notable decline of nearly six points.
Altogether, the market demographics of our survey respondents vary little year-to-year, as was the story again for the 2016 version. That’s largely because a considerable amount of respondents has similar attributes in longevity, ownership. Fifty-seven percent had 2015 sales of less than $50 million and 47 percent have been in business 50 years or longer.
Some interesting figures:
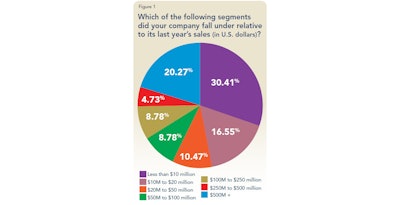
- The business size of respondents took a slight shift toward smaller this year. More than 30 percent had sales less than $10 million, up three points from 2015, while the amount that had at least $250 million in sales decreased from 34 percent last year to 25 percent in 2016 (Figure 1). At 57 percent, the segment at $50 million or less is fairly consistent to years past, while the 20 percent segment at $500M+ likely represents fewer companies since some of those respondents likely work for the same business.
- Despite 2015 being another big year for consolidation across industrial distribution, the amount of respondents who said their distributorship is family-owned rose from 58 percent in 2015 to 65 percent this year. Still, that figure is down considerably from 78 percent in 2005.
- At 36 percent, the Midwest continues to dominate in terms of respondent location, followed by the Northeast (21 percent) and Southeast (14 percent). Each of those figures is nearly identical to last year.

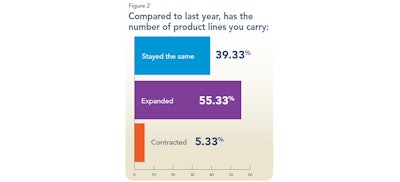
Perhaps the first sign of the ongoing industrial recession shows up when respondents are asked how the number of product lines they carry fares compared to last year (Figure 2). The segment that said product lines expanded dropped more than 10 percentage points to 55.3 percent, while the amount that have contracted product lines increased approximately 3.5 points to 5.3 percent. This is against the notion of distributors expanding their offerings to create a one-stop-shop.
As expected based on the market segment responses, the most popular product category was MRO supplies (49.7 percent), followed by safety (47.6 percent), hand tools (45.6 percent), adhesives & sealants (43.5 percent) and cutting tools (42.1 percent). Each of those were within two points of 2015. A few categories that had notable changes from a year ago included pumps (+7 percent) motors, controls & drives (-6 percent) hoses, reels & cords (-5 percent) and pneumatics (-5 percent).
Want to compare this year's results to last year? See our 2015 survey here.

Methodology
The results of this study are based on an email survey sent to Industrial Distribution subscribers. Recipients of the survey were offered an incentive to complete the questionnaire. Industrial Distribution’s subscriber base is comprised of 30,000 readers, the majority of whom identify as executive, upper management, sales or sales management. Results are based on a pool of respondents within this subscriber base.
Because Industrial Distribution transitioned to a new publisher in 2010, no survey was conducted that year. Therefore, results which track comparisons over the past decade will reflect a gap between 2009 and 2011.
Comments on this year’s results? Email ID editor Mike Hockett at [email protected].


