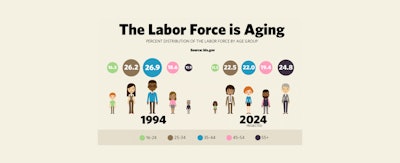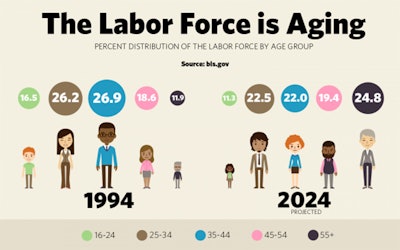
It’s a fact: our workforce is aging. By 2024, nearly 1 in 4 people in the labor force are projected to be age 55 or over.
This is a big change from 1994, when people ages 55 and older represented only 11.9 percent of the labor force — a share smaller than those held by other age groups: 16-24, 25-34, 35-44 and 45-54. But by 2024, their projected share will be the largest among these age groups.
There are two reasons for this trend. The first is an aging population: baby boomers — those born from 1946 to 1964 — are moving into older age groups. By 2024, the youngest will be 59 years old.
The second reason is an increasing labor force participation rate among older workers. Research shows many older people are remaining in the labor force longer than those from previous generations. According to one study, about 60 percent of older workers with a “career job” retire and move to a “bridge job”; that is, a short-term and/or part-time position. Another study found that about half of retirees followed nontraditional paths of retirement in that they did not exit the labor force permanently.
The big question is why: Why are older workers choosing to remain in the labor force? Here’s what we know.
Longer and more healthful lives
- Older workers wish to remain healthy and active. People have longer life expectancies, and they need enough income to live to higher ages.
- In 2014, Americans at age 65 could expect to live an additional 19.3 years according to the Centers for Disease Control and Prevention, or until about age 84. That’s up about 3 years since 1980.
Changes to retirement plans
- Few private industry employers now offer defined benefit (traditional) retirement plans to employees, and the proportion of those offering defined benefit plans has been declining. In 2015, only 8 percent offered defined benefit plans to employees, compared with 47 percent of private industry establishments offering defined contribution plans, according to data from the Bureau of Labor Statistics’ National Compensation Survey.
- Defined contribution plans typically include voluntary savings accounts, such as 401(k) plans, in which workers voluntarily make deductions from their pay into funds. Earnings from these funds are based on the amount that workers choose to invest and how the funds perform. There is more uncertainty with defined contribution plans versus traditional defined benefit plans, which consist of lifetime periodic payments to the retiree or their spouse.
Increase in Social Security retirement age
- The age to receive full Social Security benefits was raised in 1983, grows higher according to year of birth, and is currently 67 years of age for those born in 1960 or after. Benefits are even higher if one waits until age 70 to retire.
- People may stay in the labor force longer to get a higher Social Security benefit rather than a reduced one if they retire early. Currently, workers can retire at age 62 and receive a reduced benefit, while if they wait until age 67, they can get full benefits.
- The Social Security earnings test was eliminated in 2000 for workers who have reached their full retirement age. This means that if a worker is at their full retirement age, their Social Security benefits are not reduced if they earn wages.
To keep employer-based health coverage
- The percentage of businesses offering health care coverage in retirement has decreased. According to a study from the Kaiser Family Foundation, the percentage of large firms (employees greater than 200) offering retiree health benefits to active workers was 24 percent in 2016, down from 66 percent in 1998.
- Workers are not eligible for Medicare until age 65, so they may choose to continue to work to have health coverage from their employer.
Explore more BLS data on labor force demographics at www.bls.gov/cps and on labor force projections at www.bls.gov/emp. Resources on preparing for retirement are available from our Employee Benefits Security Administration.
Teri Morisi is a branch chief at the Bureau of Labor Statistics.

Graphic text and data: The labor force is aging: percent distribution of the labor force by age group. Source: BLS.gov
| YEAR | 16 to 24 | 25 to 34 | 35 to 44 | 45 to 54 | 55 + |
|---|---|---|---|---|---|
| 1994 | 16.5 | 26.2 | 26.9 | 18.6 | 11.9 |
| Projected 2024 | 11.3 | 22.5 | 22.0 | 19.4 | 24.8 |


