Industrial Distribution is excited to once again share our annual Salary Report, based on the results of our survey we conducted of our readership in June. It’s one of ID’s most popular and discussed content items of the year, and serves as a benchmark for the market for data on salary and compensation.
Our report funnels respondents’ data into three separate pools based on their job function — Executives (Owner, Chairman, CEO, CFO, CIO, COO, President or Vice President); Non-Sales Mid-Level Management (Product, Operations, Branch and/or Purchasing); and Sales Representative/Manager. Respondents’ companies range from small, family-run shops to large distributors on ID’s Big 50 List. For the results of each write-in question based on salary and benefits, obvious outliers that would significantly skew the overall result were omitted. All financial figures are in U.S. dollars.
With more than 330 respondents, our 2017 Salary Report is ID’s biggest turnout since we began the feature, and more than 20 percent bigger than 2016. Our 2017 split came in at 33 percent executives, 28 percent mid-level management and 39 percent sales rep/sales manager. Eighty-nine percent of respondents were male.
Online, we're posting this report as a three-part series. See the results of our survey's mid-level management group below. See the results of the executive group here, and we'll post the sales rep/sales manager group results on Friday.
MID-LEVEL MANAGEMENT RESULTS
The Bureau of Labor Statistics says that 50.4 percent of the 2016 American manufacturing workforce was comprised of employees aged 44 years or younger. This correlates to 52 percent of our 2015 mid-level (non-sales) management group being under 50 years old, and 48 percent last year. But this year, surprisingly, our mid-level group is significantly older, as seventy percent of respondents are at least 50 years old. Only 9 percent of this year’s group are under 40 years old — down from 28 percent in our 2016 survey.
Our mid-level (non-sales) management group’s gender break down held at 22-23 percent female the past 2 years, but that figure surprisingly jumped to 86 percent in this year’s survey.
Other mid-level demographic results:
- 41 percent are located in the Midwest; followed by the Northeast at 22 percent; South at 17 percent; West at 16 percent; and non-U.S. at 4 percent
- The largest portion — 33 percent — work at companies with at least $500 million in annual sales, which would chart at least No. 27 on our Big 50 List. Twenty-seven percent of mid-level management work at companies with less than $25 million in sales.
- The amount of mid-level respondents with a graduate degree — 11 percent — decreased by eight points from our 2016 survey, while those who say they have ‘some college’ increased by seven points
- Our respondents average tenure at their company is 18 years — up from 14 years in our 2016 survey — and have held their current position for an average of nine years — up from seven years in 2016


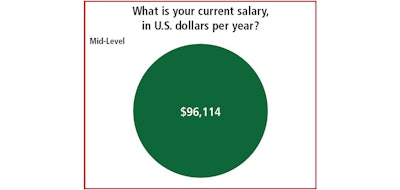
With an average salary of $96,100, our 2017 mid-level group is paid about $8,000 more than the 2016 group. The average amount of additional compensation for the 2017 group is $23,000 — up $3,000 year-over-year. That makes the total 2017 mid-level salary & compensation package average $119,000 — up considerably from 2016’s $108,000.
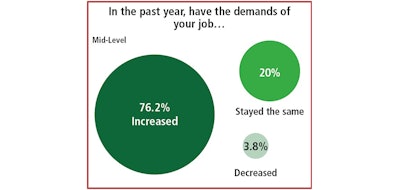
Seventy-six percent of our 2017 mid-level group say the demands of their job increased in the past year, which is actually down 10 points year-over-year, while 20 percent say demands remained the same. This correlates to a 12-point drop in the amount of respondents who say they supervise more than 20 employees. The largest portion — 46 percent — supervise five or fewer employees, though that figure has fallen each of the past two years from 59 percent in 2015.
Twenty percent of mid-level respondents say they had to take a cut in salary or benefits in the past year — down 10 points from our 2016 survey, while 66 percent received some form of raise — up nearly five points.
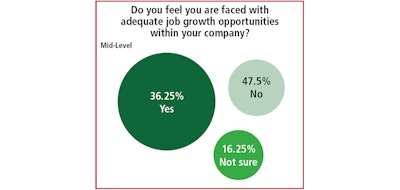
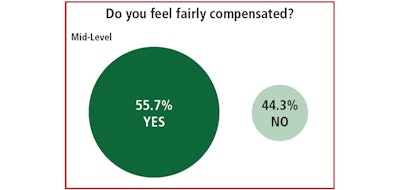
Our mid-level group tends to be the least satisfied with their overall compensation out of the three pools, and was again this year. Fifty-six percent say they feel fairly compensated — up four points year-over-year. This is despite a 17-point year-over-year drop in the amount who say they have adequate job growth opportunities at their company.
Given that 44 percent of our mid-level respondents feel unfairly compensated, it was no surprise that most of their comments were negative, as employees who feel that way are naturally more likely to voice their opinion on the matter. Here are some of those comments:
- “Compensated below peers in industry and in the company. Directly related to ‘good-old-boys’ syndrome within the core of the firm. We have lost 18 people this year with more behind them due to this one element of the firm.”
- “Rate of increased workload doesn't keep pace with salary increase. Also being with the company for nine years appears to have lagged my overall salary.”
- “As the branch manager, my purview over the branch I run is fairly autonomous. We are tasked with making numerous decisions every day that can either positively or negatively affect the bottom line. These responsibilities justify the fairness of how I am compensated.”
- “My company issued 15 percent pay cuts for everyone a few years ago because of a business downturn. The company has only reinstated the 15 percent increases for higher level managers, instead of all those who took a pay cut.”
- “I believe the market for my services can bear more. Also, I've become a valuable contributor to my company but my last raise was not equitable to my value and contributions.”


