Industrial Distribution is excited to once again share our annual Salary Report, based on the results of our survey we conducted of our readership in June. It’s one of ID’s most popular and discussed content items of the year, and serves as a benchmark for the market for data on salary and compensation.
Our report funnels respondents’ data into three separate pools based on their job function — Executives (Owner, Chairman, CEO, CFO, CIO, COO, President or Vice President); Non-Sales Mid-Level Management (Product, Operations, Branch and/or Purchasing); and Sales Representative/Manager. Respondents’ companies range from small, family-run shops to large distributors on ID’s Big 50 List. For the results of each write-in question based on salary and benefits, obvious outliers that would significantly skew the overall result were omitted. All financial figures are in U.S. dollars.
With more than 330 respondents, our 2017 Salary Report is ID’s biggest turnout since we began the feature, and more than 20 percent bigger than 2016. Our 2017 split came in at 33 percent executives, 28 percent mid-level management and 39 percent sales rep/sales manager. Eighty-nine percent of respondents were male.
Online, we're posting this report as a three-part series. See the results of our survey's Executive group below. We'll post the results of the mid-level management and sales rep/sales manager groups over the next week.
EXECUTIVE RESULTS
It’s encouraging to see more women in the industrial distribution industry as a whole and all the efforts to encourage an influx of them, but our survey shows there’s still a very long ways to go. Of our executive-level respondents, just over 5 percent are female. That’s actually up 2.6 percentage points from our 2016 survey, but way down from the 11 percent female total in 2015.
Some other executive demographic respondent stats:
- 31 percent of our executives hail from the Midwest; 24 percent are from the Northeast; 23 percent are from the South; 18 percent are from the West; and 4 percent are from outside the U.S.
- The majority — 63 percent — are employed at companies with less than $25 million in annual sales; 14 percent are at companies with $25-100 million; and 23 percent are at companies with at least $100 million in sales. As a reference point, our 2016 Big 50 List No. 50 company had $123 million in 2015 sales.
- This year’s group of executives is more highly educated than the 2016 group. More than 78 percent of 2017 respondents have a college degree — up 11 percentage points year-over-year. Nearly 26 percent have a graduate degree.
- Executives have been with their company an average of 23 years and have held their position for an average of 14 years — both figures are in line with the previous few years of our survey
Most of 2016 was rough on the industrial distribution market, which was battling an industrial recession most of the year. It forced many distributors to cut costs and headcount, and our Salary Report indicates it had some impact on executive pay, but not a major one. Nearly 16 percent of our executive respondents say they have faced salary or benefit cuts in the past year — up from 13 percent in our 2016 survey and 10 percent in 2015. On the contrary, more than 56 percent of this year’s group say they have received some form of raise in the past year — up 15 points year-over-year. Of those receiving a raise, the biggest chunk — 33 percent — say they received a standard performance-based raise. Seventeen percent say they received a considerable performance-based raise.
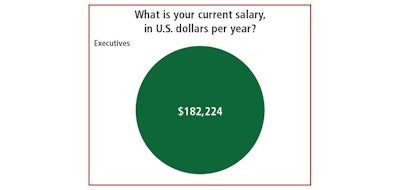
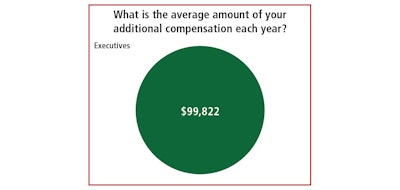
Omitting obvious outliers, the adjusted average salary of this year’s group is $187,000 — down just a hair from the $189,000 adjusted figure in our 2016 report. With an executive title often comes significant compensation perks such as bonuses, 401k contributions, education reimbursement or other additional cash. Our executive respondents receive an annual compensation amount of $100,000 — up $1,000 from our 2016 survey — for a total 2017 average salary and compensation package of $287,000.
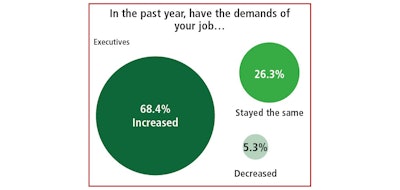
Executives say their jobs have become tougher in the past year. More than 68 percent say their job demands have increased — up nearly seven points year-over-year — while those who say their job demands went down decreased three points to 5 percent.
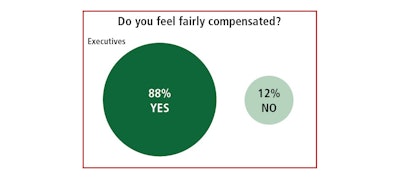
As expected, our executive group has the highest rate of job satisfaction — though it was much closer this year than in the recent past. Eighty-eight percent of executive respondents say they feel fairly compensated — down two points year-over-year. That figure was 84 percent in 2014, but held at or above 87 percent the last three years.
Comments from our executive respondents overall match the 88 percent that feels fairly compensated. Only a couple respondents’ comments said compensation didn’t match their workload. Here’s a collection of some executive comments:
- “My compensation package is more ‘pay for performance’ these days and things have worked out well for me the past few years.”
- “Overall results were not good in 2016, and therefore I have no issue with not having a salary or bonus increase.”
- “Given our size, revenues and other non-cash benefits, I believe I am fairly compensated. That being said, I would welcome an increase.”
- “I create value for my company every day, and that value turns into revenue and ultimately net income. I have the power to make more money by exceeding the annual goals I am given each year. I work hard each and every day to make that happen.”
- “I am well compensated above the industry base pay.”


