
Over the 30 years since starting the company now known as SPARXiQ, I’ve worked with over a thousand industrial B2B distributors across a broad diversity of vertical markets. What has struck me across these many years is the surprising variability of business and financial performance within industry sectors.
There’s a lot of wealth to be generated understanding and availing the forces of elite performance within a given market vertical. That’s why SPARXiQ has developed performance metrics that enable distributor performance comparisons within a given market, controlling for product mix, customer mix, project mix, regionality, etc. Our data show that, adjusting for business mix, average distributors are commonly attaining one-third to half the profitability of their fourth-quartile competitors. In this article, I’ll share some of the metrics distributors can use to track and measure profitable growth in their organization.
Where to Begin Benchmarking Your Performance
In many verticals, average distributors are attaining EBITDA of 4% on sales, while the elite distributors are attaining 8% to 12% on sales. They’re all working more or less the same number of hours per week, but they’re getting radically different outcomes. Elite distributors are earning two to three years’ average profits each year. It’s no surprise that, over time, they will have superior resources to attract and retain talent, invest in customer-centric platform capabilities, deploy next-gen technologies to accelerate organic growth, and to acquire and integrate competitors to boost inorganic growth.
So, to begin, every distributor executive team needs to know or at least approximate their EBITDA performance percentile within their industry. Industry association data, such as PAR reports, may help shed light on average values and associated quartile values. Sometimes these data will help you control for mix, but many times not as well as you would like. Nevertheless, you will need to develop a point of view on your benchmarking in order to quantify and commit to achieving fourth-quartile of performance.
The Metrics Behind the Metrics
What’s driving these differences among distributors within an industry? There are many metrics that matter, but following are several that consistently predict superior performance:

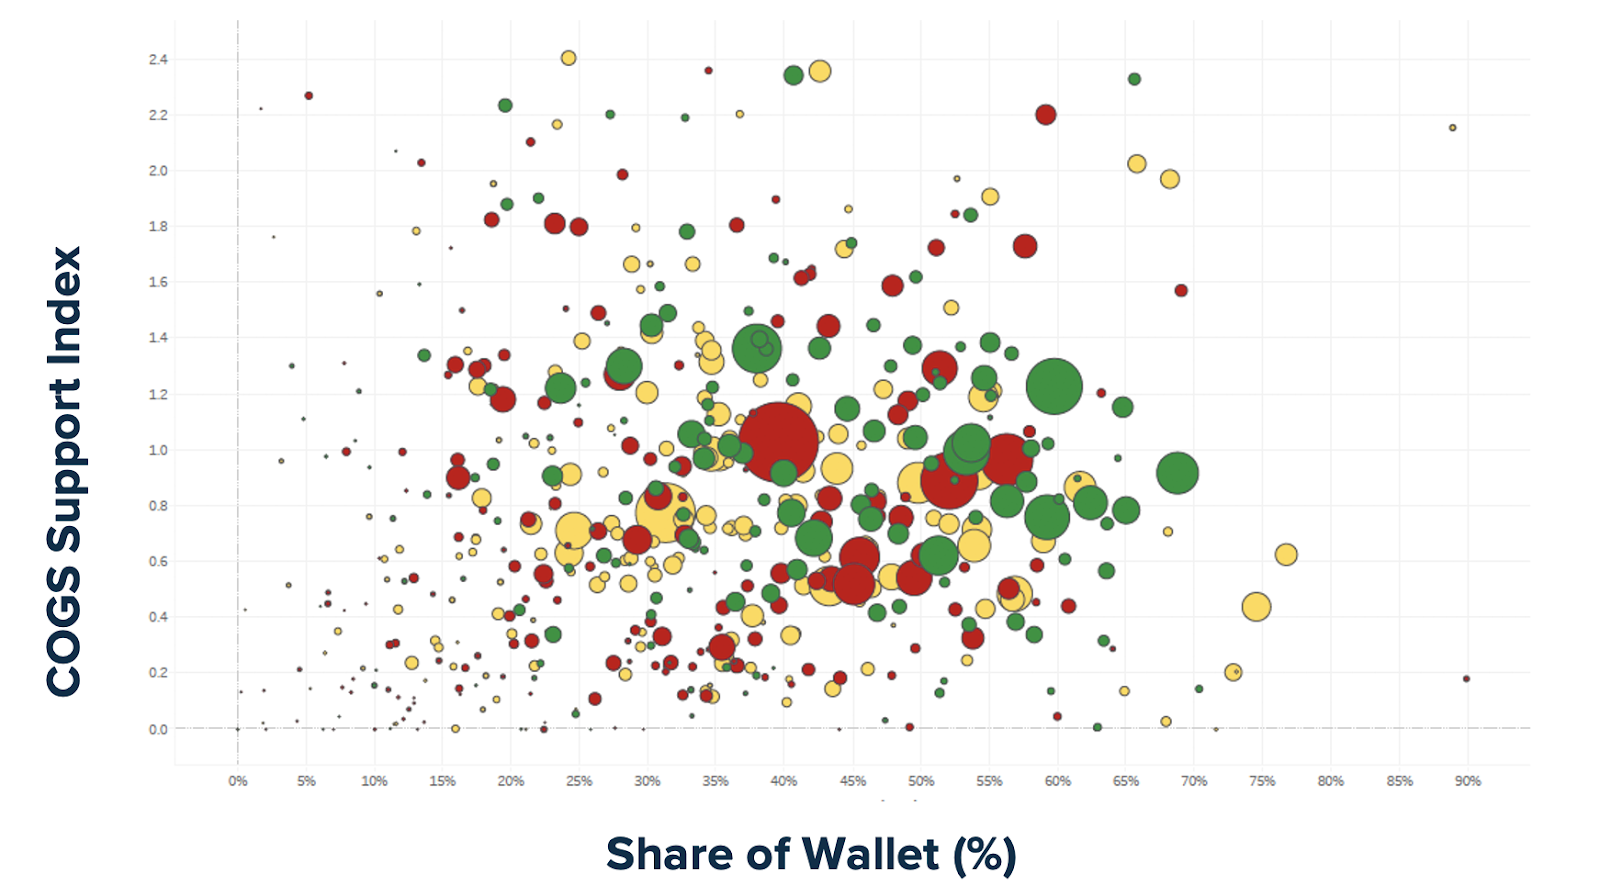
- Revenue Waterfall Percentiles: These data points segment and assesses the opposing forces that cumulatively drive or restrain (or reverse) organic growth rates. Defined as sales percentage changes for inbound new customers vs. outbound defecting customers, as well as sales percentage changes for customers with increasing share of wallet versus those with decreasing share of wallet. The sales waterfall enables clear visibility into strengths and weaknesses with respect to customer acquisition versus retention versus driving increased wallet share with steady customers. These powerful data points support sales specialization, formalized account management, and customer success initiatives.
- Pricing Performance: This is a company’s ability to create and capture customer value as well as its underlying pricing platform and disciplines. Measured as your gross margin versus market, controlling for mix of customer, product, projects, and regionality; as well as pricing methods mix (percentage of revenue priced via contracts vs. matrix vs. overrides) versus peer averages.
- Long-Term Customer Value vs Customer Acquisition Cost: The cost versus rewards of acquiring customers. Long-term Customer Value is the expected net present value of net profits of segments of customers or in total. Customer Acquisition Cost is the expected net present value of variable costs incurred in acquiring new customers. Popular in the SaaS software business, this metric assesses how effectively a company balances the value of acquiring customers vs. the resources required to acquire them. Because many distributors are weak and reactive in new business development, they haven’t bothered to measure or optimize this ratio. Outcome: slow growth and misaligned, over- or under-investment efforts and rewards.
- Purchasing Performance: the supply-side, mirror image of pricing performance. Measured as the relative terms of trade (into-stock costs or SPA cost support percentages) versus peers. For distributors to maximize customer value conversion to profit, they must not only price optimally but also source optimally. Buy-side improvements are generally perceived as less risky and potentially equally valuable but easier to manage.
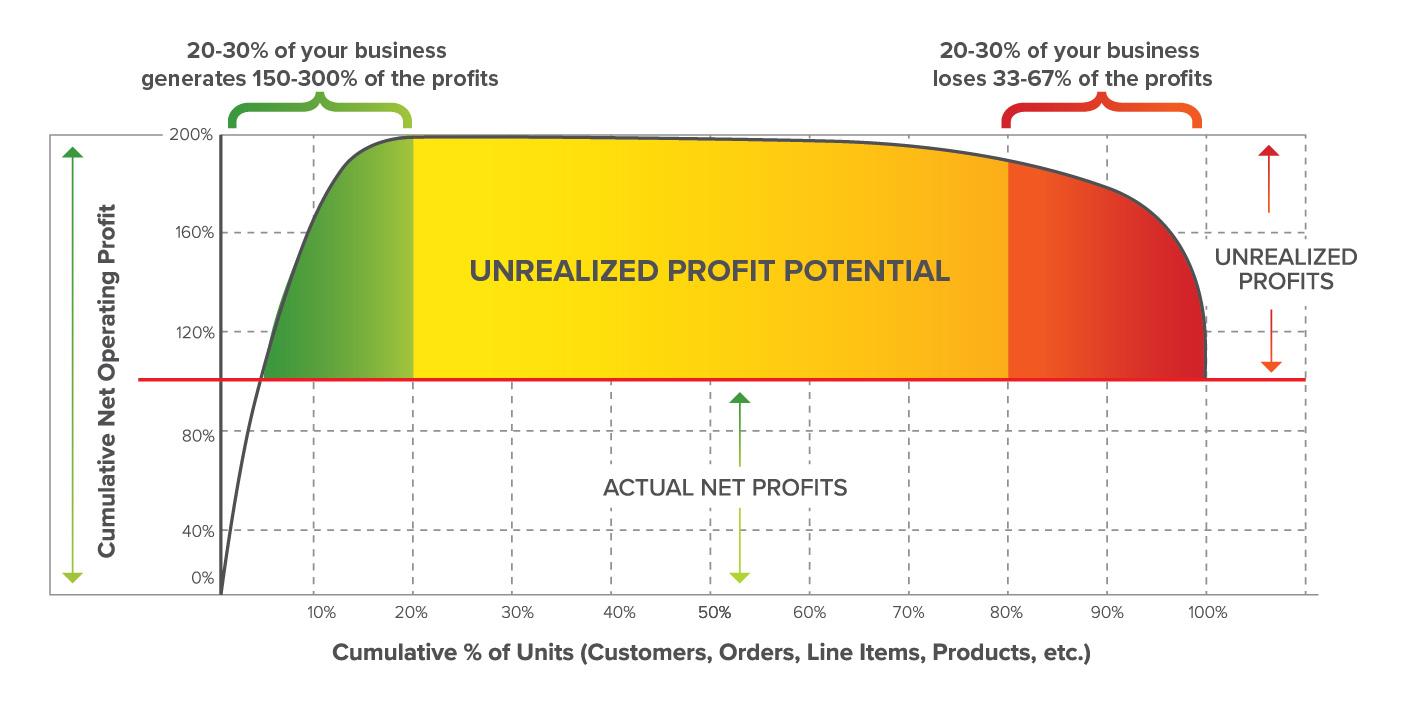
- Peak Internal Profitability (PIP) Ratio: A distributor’s ability to identify and serve the most profitable customers, products, and vendors in a market, and to minimize or eliminate those that are profit-draining. Related to the Whale Curve, PIP percentage is measured as the ratio of actual EBITDA percentage to Peak Internal Profit EBITDA percentage. Most distributors sacrifice one third to one half of their operating profits by failing to identify or remediate profit-draining customers, vendors, etc.
- Operating Profit/Operating Expense Ratio: the return on effort in the business. Measured as EBITDA divided by Operating Expenses (non-COGS expenses). Many distributors are passive as to the drivers of superior profitability, indulging a roulette wheel of productive versus unproductive efforts.
Measuring Relative Performance
A few of the metrics above may be available from common industry PAR reports. Most, however, are unavailable in industry data, and/or have too many idiosyncrasies to make reliable benchmarks. In these cases, a useful proxy is to understand your own performance variability (mean and standard deviation) across your own branches, sales territories, customer type/sizes, vendors, etc. If you can identify elite performance [generally 1.5 to 2.0 standard deviations better than mean values) within your own data, you may develop proxy values for elite performance benchmarks.
What Differences Do these Metrics Make?
With important exceptions, a distributor can only acquire peers with lower EBITDA percentage performance than their own in a non-dilutive way. To over-generalize, if you’re at median profitability, you could profitably acquire half the companies in the market. If you’re in the 90th percentile, your available options increase to 90% of peer companies. When you are elite in the metrics that matter, you will attain elite EBITDA percentage and may potentially overlay inorganic growth on top of superior organic growth. The Total Growth Rate is critical in outpacing competitors to achieve minimum efficient scale.
To Be or Not to Be — Elite
The key to sustained superior business performance is holistically mastering the metrics that matter. The job of the executive is to choose to execute on the journeys that matter. The metrics that matter may clarify the appropriate strategic pathway for distributors on each side of industry evolution. If you’d like help assessing your metrics that matter, feel free to reach out.
David Bauders is the CEO of SPARXiQ.