Growth Anew
When we conducted last year’s Survey of Distributor Operations in late March 2020, COVID-19 had only been a pandemic for a few weeks, and its harsh effects on the global economy were only beginning to be felt. And with that, most of the survey’s questions reflected business conditions as they were just before or very early in the crisis.
 ID Managing Editor Mike Hockett
As always, Industrial Distribution’s Survey of Distributor Operations aims to provide a snapshot of the industry and how distributors are faring across an array of operating areas. The coming pages will examine seven main categories:
- Demographics — establishes a profile of survey respondents based on company size, years in business, sales volume and product line
- Challenges, Trends & Economy — outlines the initiatives distributors are undertaking to address key business and market concerns, as well as mergers and acquisitions and how distributors view the impact of the economy
- Tech Usage & Investments — covers areas like e-commerce and other big-impact technology solutions for now and the future
- The Balance Sheet — offers insights into revenues and profitability, addressing areas of investment, concern and other analysis of factors impacting revenue

- Value of the Distributor — addresses the reasons our survey respondents believe customers do business with them, and which service offerings play a significant role in the industry
- Employment — identifies hiring and layoff trends, recruitment and compensation
Here in Part 1, we'll cover those first four segments. Check out Part 2 here.
Demographics
Year-to-year, the Demographics section of our survey typically shows the least change out of all seven segments. But that certainly changed this year, and sets the tone for the rest of our findings. It’s always worthwhile to get an update on the who, what and where of our respondents.
For at least the past decade, the geography of our respondent pool has favored the US Midwest, including 30.0 percent in 2020. But it’s a drastically different make-up this year, with the US Northeast leading the way at 31 percent of our pool. The Southeast and Southwest were the next most common, while the Midwest fell to fourth at 13 percent. About 7 percent of our respondents were from distributors based outside of the US.
The age of our respondents’ distributorships is also much younger this year, with only 15 percent hailing from firms that have been in business for at least 50 years, compared to 45 percent in 2020. In fact, Almost 56 percent of our pool are represented by distributors 25 years old or younger, including 27.5 percent that have been in business for less than 10 years. For an old-school industry, this year’s survey reflects a new age of distributors.
While very large distributors garner most the headlines in this market, our readership is largely comprised of small- to mid-sized firms, and that’s reflected again in our survey. The vast majority of our respondents — 71 percent — represent distributors with annual sales of no more than $50 million, which would be far too small to place on ID’s Big 50 List. On the other end of the spectrum, only 9 percent of our respondents are at companies with at least $500 million in annual sales.
While the number of respondents who said their firm expanded their number of product lines expectedly declined, it wasn’t by a drastic amount as we expected, given the pandemic’s business impacts. About 45 percent said product lines expanded compared to a year earlier, down from 53 percent in 2020, while the amount who said lines contracted grew only 3 percentage points to 8 percent this year.
Other notable demographics from our respondent pool:
- 68 percent represent distributors that are family-owned — in-line with results from recent years (69 percent in 2020)
- Our respondents’ most popular product lines are: power tools (30 percent), hand tools (26.5 percent), MRO supplies (26 percent), mobile devices (26 percent), electrical (24 percent), personal protective equipment (24 percent), hoses, reels & cords (20 percent), safety (20 percent), automation & instrumentation (19 percent) and preventative maintenance (17.5 percent)
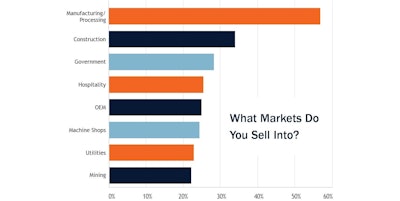
- The most popular markets our respondents sell into are: manufacturing/processing (67 percent), construction (34 percent), government (28 percent), hospitality (25.5 percent), OEM (25 percent), machine shops (24.5 percent) and utilities (23 percent)
Challenges, Trends & The Economy
We always begin this section by asking our respondents what their top concerns are (up to three), and while the top two hold their spots from last year, they show a major improvement in economic outlook. ‘Economic conditions this year’ repeated atop our list of concerns — chosen by 53 percent of our pool — but that’s far less than the 85 percent who picked the same a year ago. Likewise, 32 percent picked ‘customers going out of business’ as a top concern this year, improving from 40 percent in 2020. These figures illustrate North American economic conditions that have major growth on the horizon as we make our way through (what hopefully are) the latter months of the pandemic, compared to just entering the worst of them at the time of last year’s survey.
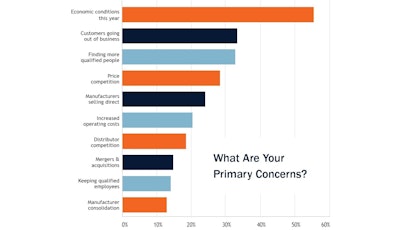
Other top concerns identified by our pool were: Finding more qualified people (31 percent), price competition (27 percent), manufacturers selling direct (23 percent), increased operating costs (19.5 percent), distributor competition (18 percent), mergers & acquisitions (14 percent) and keeping qualified employees (14 percent). “COVID-19 and associated impediments for events and meetings,” and “Inflation” were cited as write-in answers.
So now that we know the biggest concerns, how do our distributor respondents plan to grow through them? Retaining customers always tends to be more efficient for growth than the resources needed to acquire new customers, and that’s reflected by our survey pool, which picked ‘grow sales among existing customers’ as their top strategy — selected by 42 percent. That has a fair gap between the next leading growth strategy, ‘add to customer base’ at 32 percent. ‘Broaden/specialize product line (27 percent) and ‘take market share’ (23.5 percent) rounded out the top four.
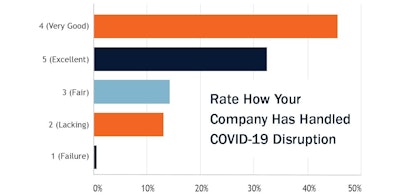
A new question we asked this year was how respondents would rate their how their company has handled disruption caused by the pandemic on a scale of 1 (failure) to 5 (excellent). The vast majority of our pool think their firm has handled the pandemic well, with respondents giving an average rating of 3.9, or ‘very good’ on our scale. Only 13 percent rated their distributorship’s performance with a 1 or 2.
Using the same scale, last year, for the first time we asked respondents to rate their company’s disaster preparedness. This year, our pool rated themselves an overall 3.82, up from 3.64 in 2020. And while this year’s respondent demographics vary considerably from a year ago as noted earlier, it’s understandable that the pandemic’s impacts should now have distributors better prepared for future disasters after dealing with a prolonged one like COVID-19. Thankfully, not a single respondent rated their company’s disaster preparedness as ‘very poor’ (1) in either year.
Other stats from this section:
- Almost 51 percent of respondents said their company was approached for a merger or acquisition, though it did not go through, essentially double the amount who said so in 2020. Another 21 percent said the their company was merged or acquired — up from 5 percent in 2020 — but this may be evidence that multiple pockets of our respondent pool may be employed at the same distributor.
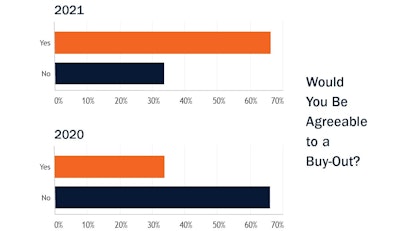
- Further on the M&A front, two-thirds of respondents said they would be agreeable to a buy-out, essentially a complete flip from 2020 (67 percent said no). A similar one-year reversal was in those who said their company is actively looking to make an acquisition — 71 percent — compared to just 31 percent who said so in 2020.
Tech Usage & Investments
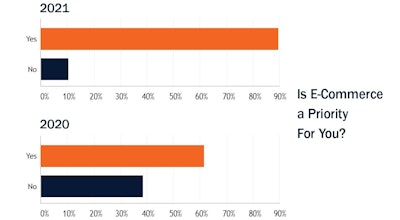
Perhaps it’s just our significantly different respondent make-up compared to recent years, or maybe it’s due to pandemic impacts, but our survey indicates that 2021 is the year distributors finally got the e-commerce wake-up call. The amount of respondents who affirm that e-commerce is a priority for them has hovered between 62 and 67 percent in the last few years — a relatively low figure considering how major distributors have used it to gain market share over the past decade, along with the rapid rise of Amazon Business. But this year, that figure jumped to 89 percent who said e-commerce is a priority, by far the highest mark in our survey’s history.
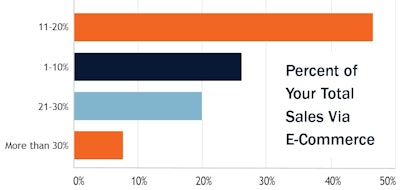
The pandemic showed just how crucial of a tool e-commerce can be during times of disruption for customers, and perhaps the past year compelled a fair amount of lagging distributors to finally pull the trigger on it. With that, 78 percent of respondents said their company is currently generating web-based revenues, compared to just 57 percent in 2020. And it’s not just notable that more of our pool is active on e-commerce, but the volume of that activity as well. Nearly half of our respondents — 47 percent — said they generate 11 to 20 percent of total company sales via e-commerce, whereas the vast majority of last year’s crop — 73 percent — said they derived only 1 to 10 percent of revenue from e-commerce.
E-commerce (44 percent) and CRM (45) percent were by far the top two selections by respondents when asked which business technologies their distributorship have in place. Warehouse management systems (31 percent), sales force automation (29.5 percent) and wireless email/Internet access (26 percent) rounded out the top five.
Looking ahead, CRM was also the top choice for which technology not currently in use is likely to be adopted in the next 2 years, picked by 38 percent of respondents. And just like the previous question, e-commerce was right behind at 35 percent. Sales force automation (29 percent), demand forecasting (19 percent) and warehouse management systems (17 percent) were the next three.
Asked which current technology has had the greatest impact on their business over the past year, CRM was the clear favorite at 43 percent, evidence of CRM’s crucial functionality in managing customer buying trends during market disruption. Online web ordering was next at 34 percent, followed by sales force automation at 18 percent.

- The top use for respondents’ website is to generate leads, with that option chosen by more than 30 percent, up from third-place and 18 percent in 2020. ‘Housing technical/product information’ was next at 23 percent, followed by e-commerce at 19 percent and ‘to find new customers’ at 14 percent
- Only 32 percent of respondents said their company had redesigned their website within the last year, compared to 45 percent who said so in our 2020 survey
- 39 percent of respondents said their distributorship updates their website content monthly, while 37 percent said they do so daily/weekly. Combined, that’s a considerably better showing than the 59.5 percent of last year’s pool that picked either option.
- More than 80 percent of respondents said their company has a mobile app for their website — a sizable jump from 63 percent in 2020, but that may again point to repeat companies represented in our pool of respondents, or just the considerable demographic differences
- 61.5 percent of respondents expect their Internet sales to increase in the year ahead
- More than 94 percent of respondents said their company buys products online, up 89 percent last year to a new all-time high
The Balance Sheet
Other than the largest industrial distributors like Grainger and Fastenal that were able to either rapidly procure PPE products critical to the COVID-19 response early in the pandemic, or those who already had PPE as a core product line to begin with, the market suffered considerably during 2020. Publicly-traded distributors announced major cost-cutting measures that included headcount reductions or furloughs, alongside capital spending freezes as means of navigating the financial impacts of the crisis. Distributors catering to the oil & gas markets were hit especially hard, as that sector was already dealing with a market downturn before COVID arrived, and oil & gas has been considerably slower to recover than other industrial verticals such as MRO.
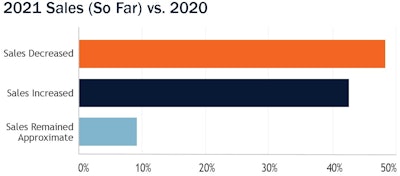
In last year’s survey, only 50 percent of our respondents said they expected their sales to increase in the next year (2021). And even that may have been overly-optimistic, as only 43 percent of this year’s pool said their sales have increased compared to the year before, while 48 percent said sales decreased. Likewise, only 43 percent said that current profits have increased compared to a year earlier. On the bright side, more than 69 percent said they expect sales to increase in the year ahead, up nearly 20 percentage points from 2020’s survey.
To achieve growth going forward, our respondents are looking to digital improvements. Asked which tactics they consider very important for growth and business development, ‘improve/redesign website (46 percent) and ‘sell more via e-commerce’ (42 percent) were the top two selections. ‘Advertising marketing (33 percent), ‘add product lines’ (30 percent) and ‘drive traffic to website’ (25 percent) were also top-five picks.
As a sign of a recovering industrial economy, the timeframe for our respondents’ payments and receivables notably shortened compared to a year ago. In our 2020 survey, the top two selections were 31-40 days (37 percent) and 41-50 days (28.5) percent. This year, the top two timeframes were 16-30 days (44 percent) and 31-40 days (22 percent).
Methodology
The results of this study are based on an email survey sent to Industrial Distribution subscribers in April 2021, with a collection time of three weeks. Recipients of the survey were offered an incentive to complete the questionnaire. The majority of ID’s subscriber base is comprised of readers who identify as executive, upper management, sales or sales management. Results are based on our pool of survey respondents from within this subscriber base.
Comments on this year’s results? Email ID managing editor Mike Hockett at [email protected].


