Money Talks
The issue of salary and compensation levels are currently sandwiched between two prevailing economic conditions: the trailing effects of the COVID-19 pandemic on business’ profits and payrolls, and modest inflation that some analysts think is more than just a temporary side effect of a rapidly recovering US economy.
As one of our many annual reports, we at Industrial Distribution use our Salary Report as a way to provide the industrial distribution market with a snapshot of current compensation rates and how the industry’s workforce feels about them — segmented by three tiers of job titles. Money certainly isn’t everything to distribution employees, but in an industry that has struggled to recruit and retain Millennials and now Gen-Z talent that is far more prone to job-hop than older generations, the almighty dollar is often an employer’s most valuable asset.
The US Bureau of Labor Statistics’ employment report issued July 2 showed that American workers are enjoying an upper hand in the job market, with average hourly wages up a solid 3.6 percent in June compared to a year earlier. Some economists have pointed to wage gains as an equal or bigger factor in inflation than rising commodity prices.
The 2021 ID Salary Report is based on a survey distributed via our digital channels of email, our daily e-newsletter and social media and conducted throughout June. The results are divided into three separate categories based on where respondents identified their specific job functions.
Though this is a long-standing survey, it was not conducted in 2019 during ID’s transition to a new publisher.
The following results are based on three separate sets of data from Executives (Owner, Chairman, CEO, CFO, CIO, COO, President or VP); Mid-Level (non-sales) Management (Product, Operations, Branch and/or Purchasing); and Sales Representative/Manager. This year’s split of more than 200 respondents came at 27 percent executives, 33 percent mid-level management and 40 percent sales rep or sales management. Overall, 85 percent of respondents were male, and the pool’s age breakdown was fairly evenly split at 22 percent under 40 years old; 21 percent at 41-50; 29 percent between 51-60; and 28 percent above 60.
Here in Part 2, we'll cover the results from Mid-Level Management. The Executives results were posted here on Tuesday, and the results for Sales/Sales Management were published Thursday.
Mid-Level (Non-Sales) Management
This segment of our respondent pool has been with their company for an average of 12.8 years. This group is just under 81% male, compared to 72% from a year earlier. Whereas exactly 50% of last year’s group was 50 years old or younger, this year’s mid-level management group is a little older at nearly 56% of segment respondents. The most popular age group in this segment is 51-60, comprising one-third of respondents. Sixty percent of this group have at least a college degree, while another 24 percent have at least some college experience under their belt.

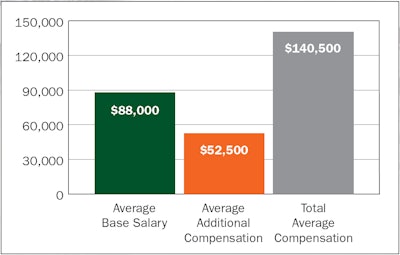
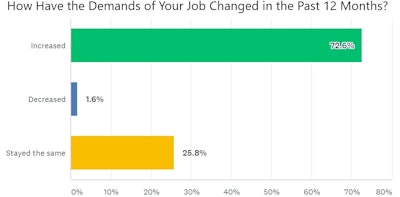
This year’s group of mid-level management respondents reports an average base salary of $88,000, down from $91,000 a year earlier. This year’s median base salary is $82,000, ranging from $40,000 to $225,000. For those who earn commission, their average commission is $52,500, bringing this group’s average total pay package to $140,500 — a sizable jump from $123,000 in 2020. While 72.5% of this group say the demands of their job have increased in the past year, 61% say they feel fairly compensated, up from 49% a year earlier.

Other mid-level management segment notes:
- Our mid-level managers have been with their company for an average of 12.75 years and held their current position for an average of 8.7 years
- For those in this group who supervise other employees, 37% oversee 1-5; 13% oversee 6-10; 6% oversee 11-20; and 11% oversee more than 20 employees
- 53% in this group are staffed at distributors with annual sales of $100 million or less
- 38% of this group are at firms headquartered in the US Midwest; 22% are in the Northeast; 14% are in the West; 11% are in the Southeast; and 9.5% are in the South
- Most mid-level managers — 55% — consider the cost of living where they live to be average, while 32% consider it to be above average
- For those who earn commission, 28% say their goals are attainable and a source of motivation, while 18.5% say their commission is inconsistent and comprise a small portion of their overall earnings
- 52% of this group say they have received a compensation increase in the past 12 months. For those who have, 61% say it was a standard, merit-based pay raise. Of those who didn’t get a raise, 16% say they saw a pay or benefits cut in the past year.
- Exactly 50% of this group expect a salary and/or benefits increase in the next 12 months

Commentary
- “We should not be paid more than a new hire.”
- “It’s the deal that I signed my contract with.”
- “I have not received a base salary raise in 5 years. Took a decrease in commission payout.”
- “Pay has not maintained pace with insurance and cost of living increases.”
- “I was promised a higher salary after 90 days. This never happened in spite of my asking.”
- “Should be making more for what the job details.”
- “Taking on more work for people who are no longer here.”
- “Always on call 24/7 365. Extra hours, no real days off. Duties not in my core area.”
- “Hourly wage is too low. We have customer service reps that make more per hour.”
ID’s Analysis
Like with our annual Survey of Distributor Operations, the results of this year’s Salary Survey were noticeably impacted by pandemic-driven economic conditions for a second-straight time. However, the conditions are rather opposite: our 2020 Salary Survey was conducted in-between the first and second wave of the pandemic in North America, whereas this year’s reached respondents as the continent had largely put the pandemic behind it and the US economy was well into a summer recovery roar.
Last summer, many publicly-traded industrial distributors and manufacturers shared company plans to make pay cuts company-wide, with some taking a top-down approach where executives took the largest reductions. At the time, pay raises were also largely frozen as a means of financially navigating the pandemic’s impacts. This summer and fall, it will be very interesting to see if these same firms say anything about plans to reinstate any of that lost employee compensation.
And while most distributors are doing much better today than they were a year ago, one respondent’s comment illustrates that not all employees are feeling the recovery. This is especially true for those small distributors where employees often wear many hats. Says one sales/sales management respondent: “Pay is solely on sales, but do not have the allotted time to make necessary sales. In between being a warehouse person, a delivery driver, inside salesperson and order expediter, I am not driving new business.” Such a comment helps keep things in perspective as the industry resumes conducting in-person business and attending trade shows again. A lot of those who make this industry work could still use some help.


