Indian River Consulting Group published its 50th and final distributor Pandemic Revenue Index on Tuesday, culminating a near-year-long effort to provide a weekly snapshot of prevailing business conditions amid the COVID-19 pandemic.
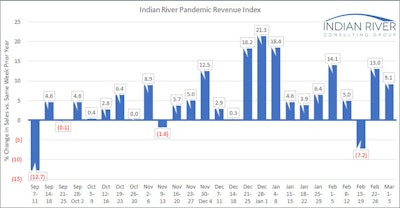
Started in mid-March 2020 as business impacts of the pandemic began to set in, the PRI ends in drastically better shape than in early spring of last year. The latest PRI — covering the selling week of March 1-5 — showed a reading of +9.1 percent, meaning that for the 13 distributors surveyed, their average year-over-year sales were up 9.1 percent.
The strong reading follows an even higher mark of +13.0 the week before, while the only contraction in the index's last 16 weeks was during Feb. 15-19, when much of the southern United States was cripled by winter weather. Seven distributors reported increases in the latest index and six reported declines.
Looking back, the PRI bottomed out during the week of April 6, when average sales among distributors surveyed were down just over 30 percent year-over-year. It was just one of nine straight weeks where the index saw double-digit declines. The index had only two double-digit declines thereafter, and one of them was the week of Sept. 7 that was impacted by Labor Day.
IRCG partner noted last week that the reason the PRI has now ended is because year-over-year sales changes after this week will have much less meaning since the baseline will no longer be before the pandemic.
"Publishing the index has been testimony to the wholesale distribution industry’s incredible resiliency," Emerson said Tuesday. "Most of the 13 distributors that participated in this week’s index have been submitting data religiously from day one. A few have joined along the way. To all that have contributed, thank you! It has been a pleasure putting this together and here’s hoping we never have to do it again!"
The index has been comprised of wholesale distribution companies in different industry verticals across the US. Participants include companies with local and national footprints.
The chart below shows the weekly percent change in year-over-year sales, unadjusted for holiday impacts:
 Indian River Consulting Group


