Indian River Consulting Group's weekly Distributor Pandemic Index continued its recent up-and-down in its newest reading, but the figures are trending significantly more in the positive lately than the negative.
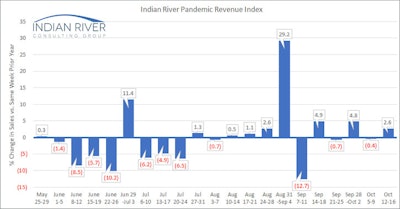
The index — aimed to show a snapshot of how industrial distributors' sales have fared during the pandemic compared to a year earlier — showed a reading of +2.6 percent for the selling week of Oct. 12-16, meaning that for the 13 distributors surveyed, their average sales for that week were up 2.6 percent year-over-year. It follows readings of -0.4, +4.8, -0.7 and +4.9 in the previous four weeks. While it has varied between positive and negative territory, the PRI's gains have been far larger than its losses over the past five weeks, while the overall range remains narrow compared to the major volatility the index saw as recent as mid-July.
Removing the weeks of Aug. 31-Sept. 4 and Sept. 7-11 that were heavily skewed due to Labor Day, the PRI has held steady since late July in the low single-digits.
In the newest PRI, seven of the 13 distributors surveyed reported increases, ranging from 3 to 26 percent. Of the six companies that saw decreases, the range was 5 to 19 percent.
IRCG would like to continue increasing the sample size for the PRI, so if you would like to include your company, reach out to IRCG partner Mike Emerson at [email protected].
The chart below shows the percent change in sales in 2020 compared with the same week in 2019, unadjusted for additional selling days for the week of July 4 and Labor Day:


