Indian River Consulting Group's weekly Distributor Pandemic Index — aimed to show a snapshot of how industrial distributors' sales have fared during the pandemic compared to a year earlier — appears to be in a new holding pattern that's bumpy, though mostly stable.
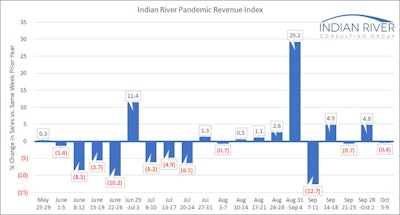
The newest PRI, covering the selling week of Oct. 5-Oct. 9, shows that IRCG's group of 13 distributors surveyed saw average sales that were down 0.4 percent year-over-year. That follows averages of +4.8 percent, -0.7 percent and +4.9 percent in the previous three weeks, respectively.
For context, the PRI held mostly in the negative mid-single digits for most of June and July before narrowing climbing back into the positive throughout August. The Labor Day holiday significantly skewed two straight weeks at the end of August and early September before the current four-week pattern that has alternated between gains near 5 percent and modest declines of less than 1 percent over the past four weeks.
Throwing out those two holiday-impacted weeks, the PRI has been essentially flat since late July.
In the newest PRI, nine of the 13 distributors surveyed reported decreases, with four of them being double digits. "Of the four companies that saw increases, the range was from less than 13 percent to 35 percent, so there is still a fair amount of variance among the participants," IRCG partner Mike Emerson noted.
IRCG would like to continue increasing the sample size for the PRI, so if you would like to include your company, reach out to Emerson, at [email protected].
The chart below shows the percent change in sales in 2020 compared with the same week in 2019, unadjusted for additional selling days for the week of July 4 and Labor Day:


