As the U.S. manufacturing economy continues to improve from the lasting effects of the pandemic, distributors are settling into a new normal that is reflected in Indian River Consulting Group's weekly Distributor Pandemic Revenue Index (PRI). After showing nine straight weeks of double-digit year-over-year sales declines from late March through mid-May, the index has gradually improved and has now held right near the breakeven mark for the past three weeks.
The latest PRI, covering the week of Aug. 10-14, showed a reading of +0.5 percent, meaning that for the 12 distributors surveyed, their average revenue for that week was up 0.5 percent compared to a year earlier. It was the second positive reading in three weeks, following a 0.7 percent decline and 1.3 percent gain in the previous two.
IRCG partner Mike Emerson noted that, like the previous week, half of the latest PRI participants saw a year-over-year sales gain. Those that had declines were in the range of -9.8 percent to -20 percent, while those with gains were in the range of +2 percent to +39.7 percent. Over the last four weeks, only two distributors have seen year-over-year increases each week. Likewise, two distributors have seen four straight weeks of declines. Emerson added that participant size, geography or industry do not appear to have an effect on the reported sales performance.
The newest PRI marked 22 weeks since IRCG first published the PRI, beginning with six distributor participants. That pool doubled to 12 last week, with distributors spanning a breadth of industry verticals in both durable and non-durable goods. IRCG now has 26 weeks, or half a year, of participants' data on-hand, enabling it to provide a six-month snapshot. As the chart below indicates, the first publication of the Index corresponds with the first pandemic related sales decline.
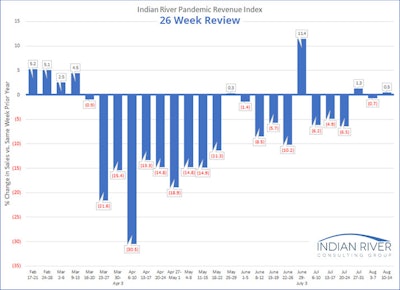
"Now, 26 weeks later, we’ve seen sales growth in two of the last three weeks. It sure would be great if the steep climb we’ve made over the last six months to get out of that spring hole is behind us," Emerson said.
IRCG would like to increase the sample size for the PRI and is calling on distributors to participate. If you are interested, reach out to Emerson at [email protected].
* The spike during the week of June 29 to July 3 likely reflects the timing of the July 4th holiday falling on Saturday compared with Thursday in 2019 resulting in an extra selling day.


