Bloomfield, CT - Kaman Corp. reported financial results for the third quarter ended September 28, 2012.
Table 1. Summary of Financial Results | ||||||||||||
In thousands except per share amounts | For the three months ended | |||||||||||
September 28, | September 30, | $ Change | ||||||||||
Net sales: | ||||||||||||
Industrial Distribution | $ | 263,328 | $ | 239,132 | $ | 24,196 | ||||||
Aerospace | 151,285 |
| 117,388 |
| 33,897 |
| ||||||
Net sales | $ | 414,613 |
| $ | 356,520 |
| $ | 58,093 |
| |||
Operating income: | ||||||||||||
Industrial Distribution | $ | 13,171 | $ | 12,252 | $ | 919 | ||||||
Aerospace | 24,410 | 19,173 | 5,237 | |||||||||
Net gain (loss) on sale of assets | (53 | ) | (14 | ) | (39 | ) | ||||||
Corporate expense | (12,419 | ) | (10,092 | ) | (2,327 | ) | ||||||
Operating income | $ | 25,109 |
| $ | 21,319 |
| $ | 3,790 |
| |||
Diluted earnings per share | $ | 0.56 |
| $ | 0.49 |
| $ | 0.07 |
| |||
Neal J. Keating, Chairman, President and Chief Executive Officer, stated, “During the third quarter we delivered solid performance in both of our businesses. Aerospace delivered 28.9% sales growth driven by deliveries of over 10,000 Joint Programmable Fuzes ("JPF") during the quarter, which offset lower sales volume on certain other programs. In Distribution, we achieved double digit sales growth and completed two strategic acquisitions that we believe will continue to propel growth in the future.
Industrial Distribution sales growth was 10.1%, driven by our recent acquisitions, while organic sales were flat during the quarter. We were able to achieve a 5.0% operating profit margin for the third quarter by focusing on cost control initiatives, despite flat organic sales and the September acquisition of the assets of Zeller Corporation, which was dilutive to the operating margin percentage for the period. In addition, we incurred higher costs from our investment in our new ERP system and acquisition due diligence and integrations.
Aerospace sales performance was led by the JPF program the strength of which offset lower deliveries on several other programs, most notably the BLACK HAWK and Unmanned K-MAX®. As expected, sales of our bearing product lines were solid despite being lower sequentially coming off an extremely strong Q2 performance. The 16.1% operating profit margin in Aerospace benefited from favorable JPF sales volume in the quarter, offset by a less profitable mix of bearing sales and a one time charge for a contract claim settlement.
We are monitoring business conditions, particularly defense spending issues in Aerospace and certain end market weakness within Distribution. Proactive expense reduction actions have been taken where appropriate and contingency plans have been developed in the event conditions warrant more aggressive actions. Overall, we are pleased with our performance in the quarter and believe we continue to make progress with our long term strategy.”
Segment reports follow:
Industrial Distribution segment
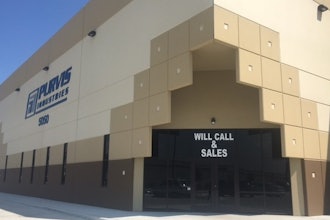
Sales increased 10.1% in the third quarter of 2012 to a record $263.3 million compared to $239.1 million a year ago. Acquisitions contributed $24.4 million in sales in the quarter (sales from acquisitions are classified as organic beginning with the thirteenth month following the acquisition). On a sales per sales day* basis, sales increased 10.1% over last year's third quarter, with organic sales flat for the period. (See Table 3 for additional details regarding the Segment's sales per sales day performance.) This was primarily due to increases in primary metal and fabricated metals manufacturing, merchant wholesalers and durable goods, and paper manufacturing mostly offset by declines in the food and beverage industries.
Segment operating income for the third quarter of 2012 was $13.2 million compared to operating income of $12.3 million in the third quarter of 2011. The operating profit margin for the third quarter of 2012 was 5.0%. Operating profit dollars were higher year over year due to the contribution of operating income from our 2011 and 2012 acquisitions. This increase was partially offset by increased employee related costs, higher ERP implementation costs and acquisition integration expenses.
Aerospace segment
Sales were $151.3 million, an increase of $33.9 million from sales of $117.4 million in the third quarter of 2011. This increase was due to deliveries of over 10,000 JPF to the US Government. Additionally, strong performance from bearing product lines; increased deliveries under the A-10 re-wing program; higher volume of sales on our legacy fuze programs; higher sales on our helicopter aftermarket programs, including the Egypt SH-2G(E) upgrade program and K-MAX spares; and contributions from the acquisition of Vermont Composites contributed to the increased sales. The increases were partially offset by lower sales on several programs including the Unmanned K-MAX and BLACK HAWK cockpit production programs and lower engineering design work on certain commercial aircraft programs.
Operating income for the third quarter of 2012 was $24.4 million, compared to operating income of $19.2 million in the third quarter of 2011. The operating margin in this year's third quarter was 16.1% as compared to 16.3% in the prior year. The increase in operating income resulted from higher deliveries of JPF and higher gross profit resulting from increased sales volume on other legacy fuze programs. Also benefiting margin was the absence of legal fees related to FMU-143 litigation. These increases were offset by a less profitable mix of bearing products, the declines mentioned in the preceding paragraph and the write-off of $0.6 million related to the settlement of a claim for one of our legacy fuze programs.
Outlook
The Company's updated expectations for 2012 are as follows:
- Industrial Distribution:
- Sales of $1,040 million to $1,055 million
- Operating margin of 5.1% to 5.3%
- Aerospace:
- Sales of $585 million to $595 million
- Operating margin between 15.7% and 16.0%
- Corporate expenses of approximately $49 million
- Interest expense of approximately $11.5 million
- Estimated tax rate of between 34.5% and 35.0%
- Free cash flow* in the range of $25 million to $30 million.
Chief Financial Officer, William C. Denninger, commented, "While significantly stronger than last year our results for the quarter were slightly below expectations, and with additional push outs in Aerospace we are lowering our outlook for the full year. At Aerospace, the ability to increase our JPF deliveries has allowed us to offset some delivery push outs on other programs. This lower volume, although disappointing, has been driven by a shift in near term customer requirements. At Distribution, our strategy of focused growth through acquisition delivered double digit sales growth for the period, while weakness in certain end markets we serve resulted in flat organic sales. We believe organic sales trends will remain weak through the fourth quarter. Corporate expense was higher in the quarter as a result of $1.0 million of acquisition costs incurred and $0.6 million of severance costs. We are managing costs across the company in an effort to ensure we maintain our profit margin and are able to react to changing market conditions. Our free cash flow* generation in the quarter was strong at $34.0 million.”
Please see the MD&A section of the Company's SEC Form 10-Q filed concurrent with the issuance of this release for greater detail on our results and various company programs.
A conference call has been scheduled for tomorrow, November 1, 2012 at 8:30 AM EDT. Listeners may access the call live by telephone at (800) 884-5695 and from outside the U.S. at (617) 786-2960 (passcode: 54733525); or, over the Internet through a link on the home page of the Company's website at http://www.kaman.com. In its discussion, management may include certain non-GAAP measures related to company performance. If so, a reconciliation of that information to GAAP, if not provided in this release, will be provided in the exhibits to the conference call and will be available through the Internet link provided above.
Table 2. Summary of Segment | ||||||||||||||||
Information (in thousands) | ||||||||||||||||
For the three months ended | For the nine months ended | |||||||||||||||
September 28, | September 30, | September 28, | September 30, | |||||||||||||
Net sales: | ||||||||||||||||
Industrial Distribution | $ | 263,328 | $ | 239,132 | $ | 779,082 | $ | 717,309 | ||||||||
Aerospace | 151,285 |
| 117,388 |
| 429,733 |
| 402,120 |
| ||||||||
Net sales | $ | 414,613 |
| $ | 356,520 |
| $ | 1,208,815 |
| $ | 1,119,429 |
| ||||
Operating income: | ||||||||||||||||
Industrial Distribution | $ | 13,171 | $ | 12,252 | $ | 40,596 | $ | 37,002 | ||||||||
Aerospace | 24,410 | 19,173 | 66,469 | 62,952 | ||||||||||||
Net gain (loss) on sale of assets | (53 | ) | (14 | ) | (21 | ) | (50 | ) | ||||||||
Corporate expense | (12,419 | ) | (10,092 | ) | (36,256 | ) | (29,947 | ) | ||||||||
Operating income | $ | 25,109 |
| $ | 21,319 |
| $ | 70,788 |
| $ | 69,957 |
| ||||
Non-GAAP Measure Disclosure
Management believes that the non-GAAP (Generally Accepted Accounting Principles) measures indicated by an asterisk (*) used in this release or in other disclosures provide important perspectives into the Company's ongoing business performance. The Company does not intend for the information to be considered in isolation or as a substitute for the related GAAP measures. Other companies may define the measures differently. We define the non-GAAP measures used in this report and other disclosures as follows:
Organic Sales per Sales Day - Organic sales per sales day is defined as GAAP “Net sales from the Industrial Distribution segment” less sales derived from acquisitions, divided by the number of sales days in a given period. Sales days are essentially business days that the Company's branch locations are open for business and exclude weekends and holidays. Sales days are provided as part of this release. Management believes organic sales per sales day provides an important perspective on how net sales may be impacted by the number of days the segment is open for business and provides a basis for comparing periods in which the number of sales days differ.
The following table illustrates the calculation of organic sales per sales day using “Net sales: Industrial Distribution” from the “Segment and Geographic Information” footnote in the “Notes to Condensed Consolidated Financial Statements” from the Company's Form 10-Q filed with the Securities and Exchange Commission on October 31, 2012. Sales from acquisitions are classified as organic beginning with the thirteenth month following the acquisition. Prior period information is adjusted to reflect acquisition sales for that period as organic sales when calculating organic sales per sales day.
Table 3. Industrial Distribution - Organic Sales | ||||||||
For the three months ended | ||||||||
September 28, | September 30, | |||||||
Net sales: Industrial Distribution | $ | 263,328 | $ | 239,132 | ||||
Acquisition related sales | 24,368 |
| — |
| ||||
Organic sales | $ | 238,960 | $ | 239,132 | ||||
Sales days | 63 |
| 63 |
| ||||
Organic sales per sales day | $ | 3,793 |
| $ | 3,796 |
| ||
% change | (0.1 | )% | 7.2 | % | ||||
Free Cash Flow - Free cash flow is defined as GAAP “Net cash provided by (used in) operating activities” less “Expenditures for property, plant & equipment.” Management believes free cash flow provides an important perspective on the cash available for dividends to shareholders, debt repayment, and acquisitions after making capital investments required to support ongoing business operations and long-term value creation. Free cash flow does not represent the residual cash flow available for discretionary expenditures as it excludes certain mandatory expenditures such as repayment of maturing debt. Management uses free cash flow internally to assess both business performance and overall liquidity. The following table illustrates the calculation of free cash flow using “Net cash provided by (used in) operating activities” and “Expenditures for property, plant & equipment”, GAAP measures from the Condensed Consolidated Statements of Cash Flows.
This article has been truncated. You can see the rest of this article by visiting http://www.businesswire.com/news/home/20121031006411/en.

