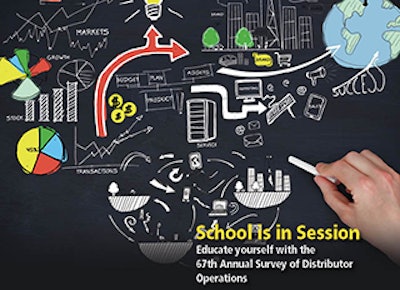
We’re excited to provide the readers of Industrial Distribution with the results of our 67th annual Survey of Distributor Operations. The objectives of this report, as always, have been to understand the most critical issues affecting distributors, and to provide data to help drive their educated business decisions. In this segment, we focus specifically on:
- Demographics, which establishes a profile of survey respondents based on company size, sales volume, and product line.
- Challenges, Trends & Economy, which outlines the initiatives distributors are undertaking to address key business and market concerns.
- The Balance Sheet, which offers insights into revenues and profitability.
- Best Practices, which sheds light on distributor relationships with suppliers and customers, as well as their global business plans.
- Tech Usage & Investments, which covers areas like e-commerce and other big-impact technology solutions.
- Value of the Distributor, which addresses the reasons our survey respondents believe customers do business with them.
- Employment, which identifies hiring and layoff trends, recruitment, and compensation.
Methodology
- The results of this study are based on an email survey sent to Industrial Distribution subscribers. Recipients of the survey were offered an incentive to complete the questionnaire.
- Industrial Distribution’s subscriber base is comprised of 27,000 readers, the majority of whom identify as executive, upper management, sales, or sales management. Results are based on a pool of respondents within this subscriber base.
- Because Industrial Distribution transitioned to a new publisher in 2010, no survey was conducted that year. Therefore, results which track comparisons over the past decade will reflect a gap between 2009 and 2011.
Comments on this year’s results? Email ID’s executive editor, Anna Wells, at [email protected].
The Balance Sheet
Last year’s “Balance Sheet” section may have felt like a bad omen, as it showed some year-over-year sales declines for the distributors who responded to our survey. In fact, last year’s group of 58 percent who said they’d experienced a sales increase that year was the lowest since the peak recession year of 2009. A full 17 percent said they’d actually experienced a sales decline, which was a much higher result than what was reported in 2011 and 2012.
On a positive note, this year’s survey respondents seem to be leveling out a little when it comes to sales. Nearly 65 percent say their sales have increased over last year, with over 22 percent saying they’ve stayed the same (Figure 1). This means the ones dealing with a decline have dropped more than four percentage points. From the perspective of larger companies, this past Fall’s Industrial Distribution Big 50 List featured more companies with a billion+ dollars in sales than it ever has before. In fact, the top 18 companies have all hit the billion dollar mark, with #1 Wolseley topping $19 billion in annual sales.
While sales may be up for some, profitability appears to be a bit stagnant. Last year, 51 percent said their profits had increased year-over-year, which is about the same as what has been reported this year (Figure 2). The bright spot, though a slight one, is that the number who said profits had decreased went down by 2.5 percentage points (from 20 percent to 17.5).
Optimism for next year’s sales seems to have improved a bit as well. Of this year’s survey respondents, 76 percent say they expect sales to increase in the coming year. While this result is similar to what we saw last year, the number of folks who feel their sales will decrease (four percent) is a marked improvement over last year, where eight percent said the same. It’s possible that last year’s pessimism may have partially been a reflection of the federal in-fighting over the ACA (Affordable Care Act), as well as economic issues like the sequester cuts adding stress to the books and encumbering decisions. Luckily, some of the latest economic forecasts have been optimistic as it relates to our survey respondent’s largest customer category — manufacturing.
According to PwC ‘s Q1 Manufacturing Barometer, the positive sentiment about the prospects of U.S. commerce in the next 12 months reached the highest level since the fourth quarter of 2005.
Additional input from PwC says:
- 82 percent expect positive revenue growth for their own companies in the next 12 months, with 15 percent forecasting double-digit gains.
- 56 percent plan to add employees to their workforce over the next 12 months and the most sought-after employees will be skilled labor (33 percent), production workers (30 percent), and professionals/technicians (28 percent), but there is also a concern about the lack of qualified workers.
- Lack of demand was cited as the leading potential barrier to growth in the next 12 months for 44 percent of respondents followed by concerns about legislation/regulatory pressures (38 percent).
Outside of manufacturing, the second largest category for our survey respondents to sell into (as identified on page 23) is construction, an industry that’s seeing some up-and-down activity. According to Bloomberg, the residential construction industry’s recovery has been challenged by higher interest rates, slow wage growth, and tight credit. On the commercial side, most predicted a stabilization in building starts in 2014 and 2015 as the overall economy continues to stabilize.
Besides economic factors, there are some customer relations issues that can create a shift in the dynamic — and also, an erosion in profits. One such issue that distributors tend to become snarled in – often to their detriment – is that of terms and conditions. In an interview earlier this year, Richard Reffler, president of the electrical and industrial distribution divisions of Big 50 distributor Turtle & Hughes, suggested that terms and conditions are becoming so sophisticated that some customers are predicting interest rates out nearly 18 months. The result is they are trying to negotiate extended payment terms, leaving the distributor wondering whether they should be acting more like a bank. On average, our respondents say their payment terms work out to be 31-40 days (34 percent) or 41-50 days (33 percent). Nine percent describe the time frame for their payments and receivables as 61 days or more, which is as high as its been since 2009. What’s further alarming is that, of this group, more than two percent say their time frame is 90 days+. In 2013, this group was comprised of less than half a percent of all respondents. On a positive note, 25 percent of survey respondents say they get paid within 30 days, which is a slight improvement over the last three years reported, which were all closer to 20 percent.
Our survey also asked readers of Industrial Distribution which tactics they’d consider to be very important for growth and business development. Just like the last few years, “Advertising and Marketing” topped the list, with 52 percent saying they planned to focus efforts in this area (Figure 3). Adding product lines, selling more through the website, and improving/redesigning the website are also strategies that respondents suggest were of critical importance. Lower on the scale of priority are areas like doing business overseas — which 12 percent of our respondents said they considered to be very important. Also of less importance were setting up new branches and hiring more employees.
Stay tuned! The next section of the survey - "Best Practices" - will appear in our newsletter on Friday, the 9th.
To view the entire survey in our digital edition, please click here.